RTS5PatternBTCPrice
RTS5PatternBTCPrice is an analytical indicator for MetaTrader 5 focused on one simple question: How did the market behave in the past when price looked similar to now?
The indicator does not attempt to predict price direction on its own. Instead, it provides a structured historical context by searching for recurring price formations and evaluating their subsequent outcomes. The result is a calm, statistical perspective that helps traders reason more clearly about their current setup.
Core Principle
Markets often repeat similar structures, but outcomes are never guaranteed. RTS5PatternBTCPrice works with this reality.
You define a price pattern using a selected number of candles. The indicator then scans historical data and compares past situations with the current structure. The goal is not to forecast, but to measure similarity and observe how price behaved after comparable conditions.
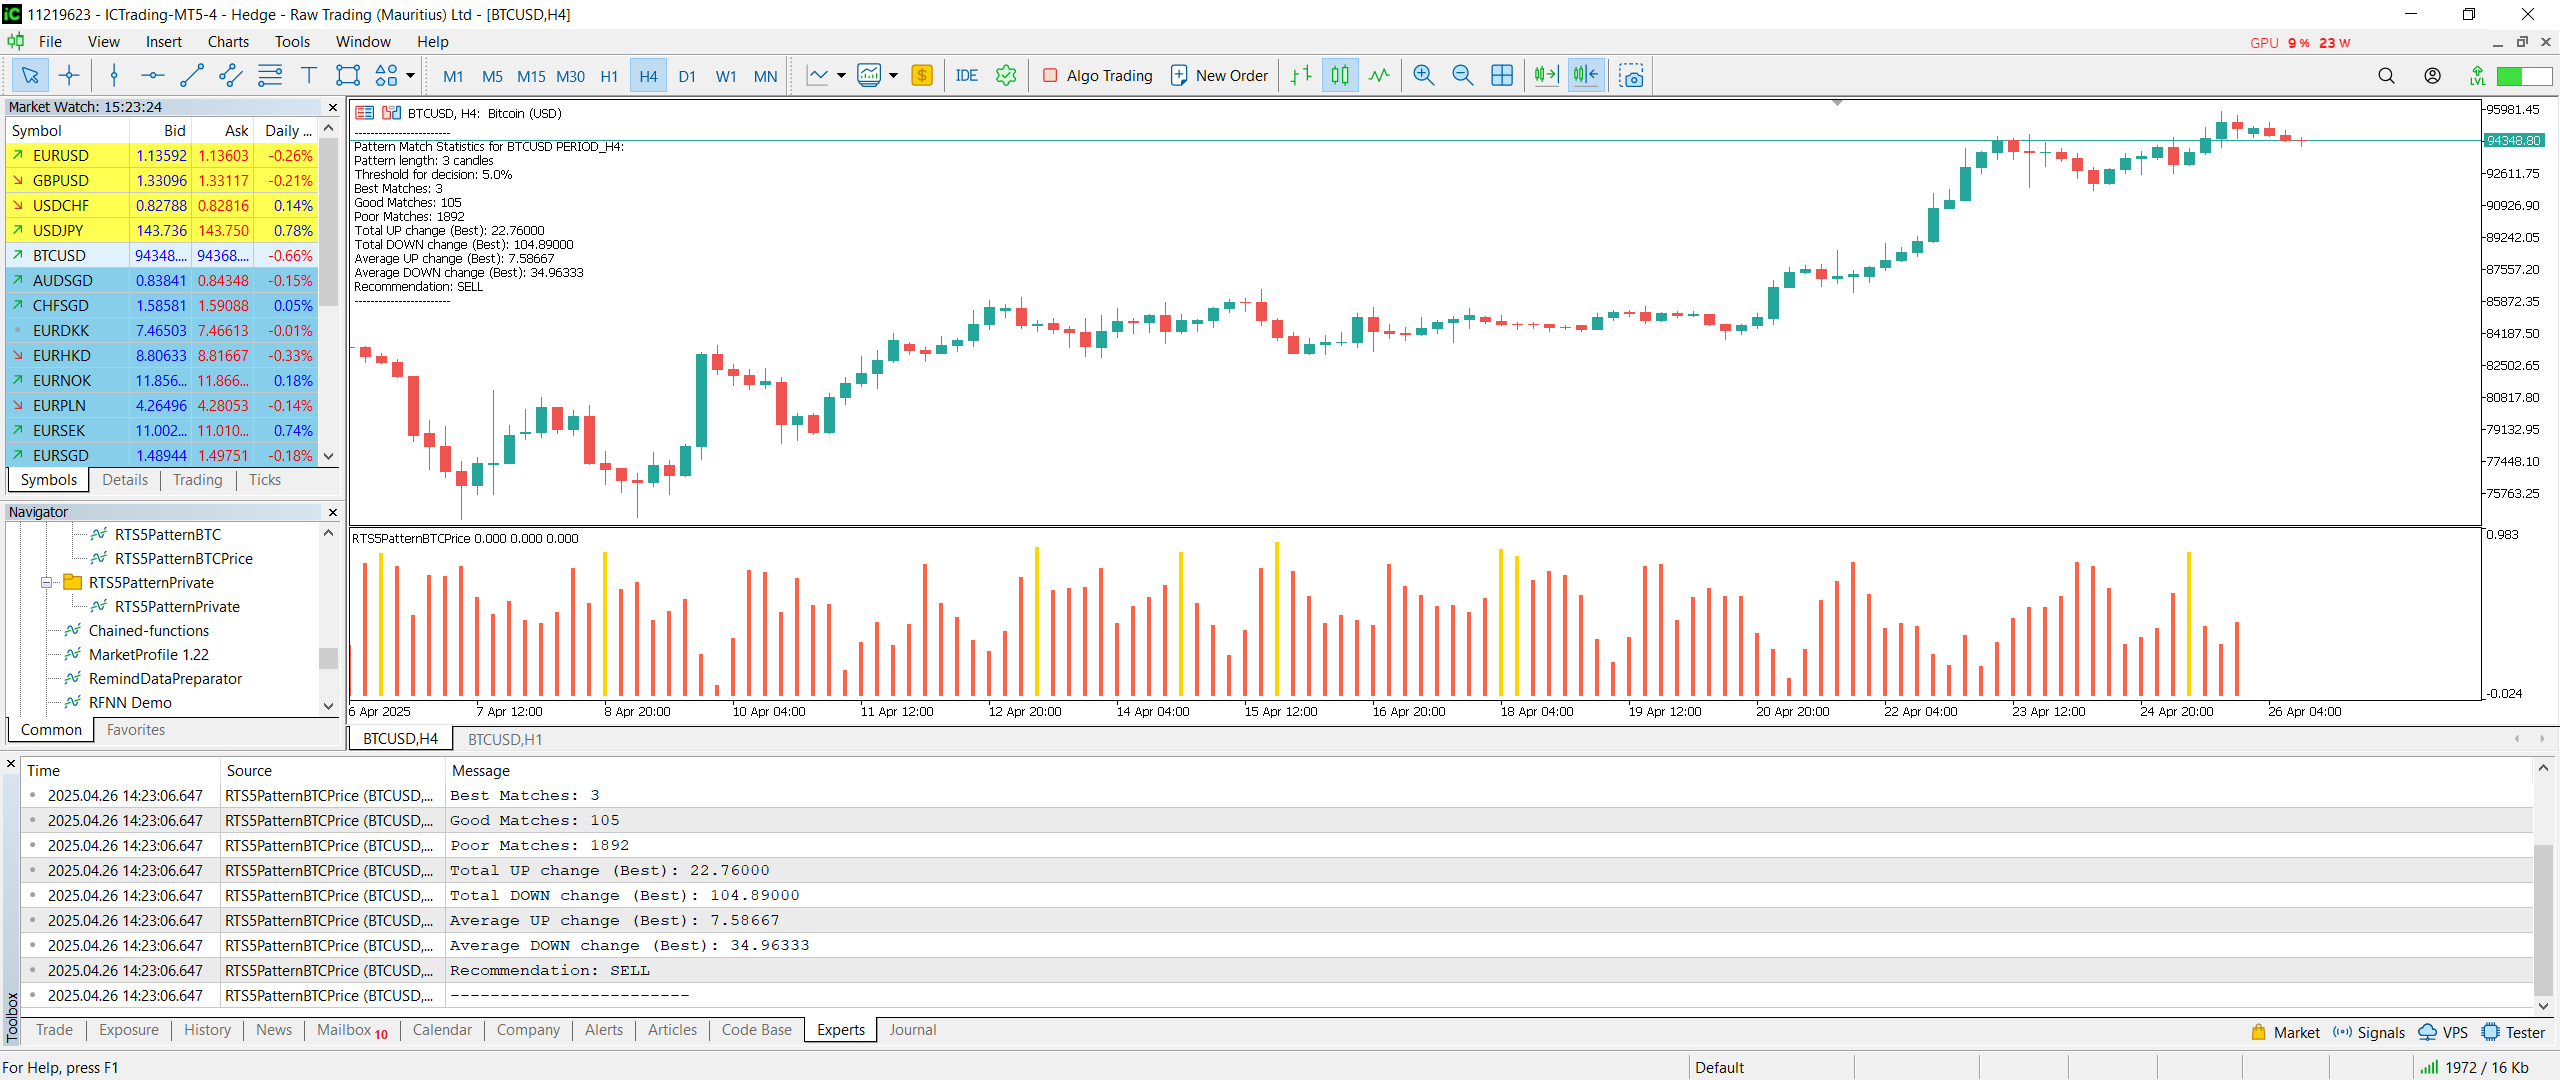
Histogram: Measuring Similarity, Not Direction
Similarity results are visualized using a histogram with three categories:
- Good Match – high similarity (green)
- Average Match – medium similarity (yellow)
- Poor Match – low similarity (red)
Each histogram bar represents one historical pattern found within the defined history range (for example, the last 2000 bars). The height of the bar reflects how closely that historical situation resembles the current market setup.
Important: the histogram does not indicate buy or sell direction. It only shows how often similar structures appeared in the past and how strong those similarities were.
Statistical Evaluation
Beyond visual comparison, the indicator evaluates what happened after the best-matching historical patterns:
- Average upward price movement
- Average downward price movement
- Total distribution of outcomes
From this comparison, a statistical bias is derived:
- BUY – historical cases favored upward movement
- SELL – historical cases favored downward movement
- STOP – no meaningful directional bias detected
This output is purely statistical. It is not an entry signal and should never be used mechanically.
Practical Usage
RTS5PatternBTCPrice is designed to support decision-making, not replace it. Typical workflow:
- Configure pattern length, historical range, and evaluation window according to your timeframe and instrument.
- Observe the histogram to assess whether the current setup has meaningful historical precedents.
- Review statistical outputs to understand how price tended to behave after similar formations.
- Combine this information with price action, market structure, trend context, or fundamentals.
- Make the final decision yourself.
Risk Awareness
Past market behavior does not guarantee future results. RTS5PatternBTCPrice should always be used as part of a broader trading plan that includes risk management, position sizing, and contextual market analysis.
The indicator offers information, not certainty.
Summary
RTS5PatternBTCPrice provides a structured, unbiased view of historical price behavior based on pattern similarity. Its purpose is to slow the trader down, introduce context, and replace emotional reactions with measurable observation.
It does not tell you what to do. It helps you understand why a decision might—or might not—make sense.

RTS5PatternBTCPrice
RTS5PatternBTCPrice is an analytical indicator for MetaTrader 5 that searches historical price data for patterns similar to the current market structure and shows how the market behaved after comparable situations.
Key Features
- Historical price pattern comparison
- Visual similarity histogram
- Good, Average, and Poor match categories
- Support for chart-based market evaluation
Use
Suitable for traders who want a quick visual and statistical overview of historical pattern similarity in the current market.
Note
This tool provides historical comparison and analytical support. It does not guarantee future trading results.

Author: Tomáš Bělák