A trading indicator became an open research project.
RTS Pattern Profi investigates whether historical price-pattern analogues can forecast market direction.
Our tests on BTCUSD and EURUSD did not confirm a robust predictive or trading advantage.
We are publishing that result clearly, including the failures.
Free · no paid plansResearch useNot validated as a profitable strategy
!
Public conclusion: in the tested configuration, RTS probabilities were worse calibrated
than a constant base-rate forecast and the apparent trading edge did not survive an independence check and realistic costs.
Observed evidence
The result is negative—and scientifically useful.
These are walk-forward observations from H4 data using a fixed 20-bar forecast horizon.
The non-overlapping subset retains one observation per horizon to reduce dependence between neighbouring forecasts.
BTCUSD · H4
13 Feb 2020 – 17 Jun 2026
Not confirmed
13,231walk-forward observations
49.78%direction accuracy
−0.190Brier Skill Score
1.061gross proxy PF, before costs
−0.150%independent model-direction return
662non-overlapping observations
The gross R proxy was slightly above one, but direction accuracy remained random and probabilities were materially miscalibrated.
EURUSD · H4
13 Feb 2020 – 16 Jun 2026
Not confirmed
9,861walk-forward observations
49.58%direction accuracy
−0.198Brier Skill Score
1.013gross proxy PF, before costs
0.886non-overlapping proxy PF
494non-overlapping observations
The full-sample margin was only +0.0091 R per trade before costs. The non-overlapping sample fell to −0.0817 R and PF 0.886.
Probability calibration
The displayed percentages must not be read as validated probabilities.
On EURUSD, realised upside stayed close to 50% across almost every forecast bucket.
A reported 84% upside score was followed by an actual rise only 45% of the time.
Forecast 6%
59%
Forecast 25%
49%
Forecast 45%
51%
Forecast 65%
50%
Forecast 75%
50%
Forecast 84%
45%
RTS scorerealised up rate
What this means
The panel labels P(up) and P(down) describe the weighted outcome share among selected historical analogues.
They did not behave like calibrated probabilities on the tested data.
Until a revised model passes new out-of-sample tests, these values should be called
analogue outcome scores, not expected win rates or probabilities of future market direction.
This is a central limitation, not a minor disclaimer. It changes how every directional panel result must be interpreted.
Research method
Designed to expose failure, not to optimise it away.
The research EA recorded every eligible closed-bar forecast and its later realised outcome.
Analysis was performed outside the indicator so that reporting rules could not change after seeing individual trades.
01
Walk-forward records
Each forecast uses only information available at its reference time. Future H4 bars are used solely to measure the outcome.
02
Calibration first
Brier score and reliability buckets test whether the reported confidence corresponds to observed frequency.
03
Independence check
A one-per-horizon subset reduces the artificial confidence created by overlapping 20-bar forecasts.
04
Simple benchmarks
RTS is compared with the unconditional base rate and a basic momentum direction, not only with its own past versions.
05
Economic outcome
Mean R, TP-first, SL-first and a gross profit-factor proxy are reported. Costs are explicitly separated.
06
Failures included
Weak years, negative subsets and scenario categories that underperform remain part of the published conclusion.
EURUSD year stability
Performance changed with the market regime.
A durable research claim should remain directionally consistent through time. The observed proxy profit factor did not.
Year
Records
Accuracy
Brier
Mean R
Gross PF
2020
1,375
49.75%
0.308
+0.008
1.011
2021
1,559
48.49%
0.311
−0.011
0.984
2022
1,554
51.80%
0.287
+0.099
1.139
2023
1,554
51.35%
0.290
+0.077
1.119
2024
1,560
45.58%
0.310
−0.121
0.828
2025
1,554
50.58%
0.293
+0.014
1.020
2026*
705
49.50%
0.301
+0.001
1.001
* 2026 is partial through 16 June. All PF values are research proxies before spread, commission and slippage.
Known limitations
What this study proves—and what it does not.
Not supported by the evidence
We found no basis for claiming calibrated directional probabilities, reliable signal accuracy,
a robust standalone trading edge, guaranteed performance or suitability for automatic execution.
What may still be useful
RTS can visualise similar historical paths, dispersion, support/resistance context and temporal metadata.
These are exploratory research aids, not validated trade recommendations.
Study boundaries
Current published evidence covers BTCUSD and EURUSD on H4, primarily with a 24-bar pattern and 20-bar horizon.
Results may not generalise, but alternative settings require fresh pre-specified tests—not marketing extrapolation.
Trading costs
Gross proxy PF excludes spread, commission, slippage, execution latency and financing.
On EURUSD, the full-sample margin was so small that approximately 0.0091 R of cost per trade would remove it.
No investment advice
This project is educational and experimental. It does not provide personal investment advice.
Do not risk capital on these outputs. Leveraged trading can cause rapid and substantial losses.
Research instrument
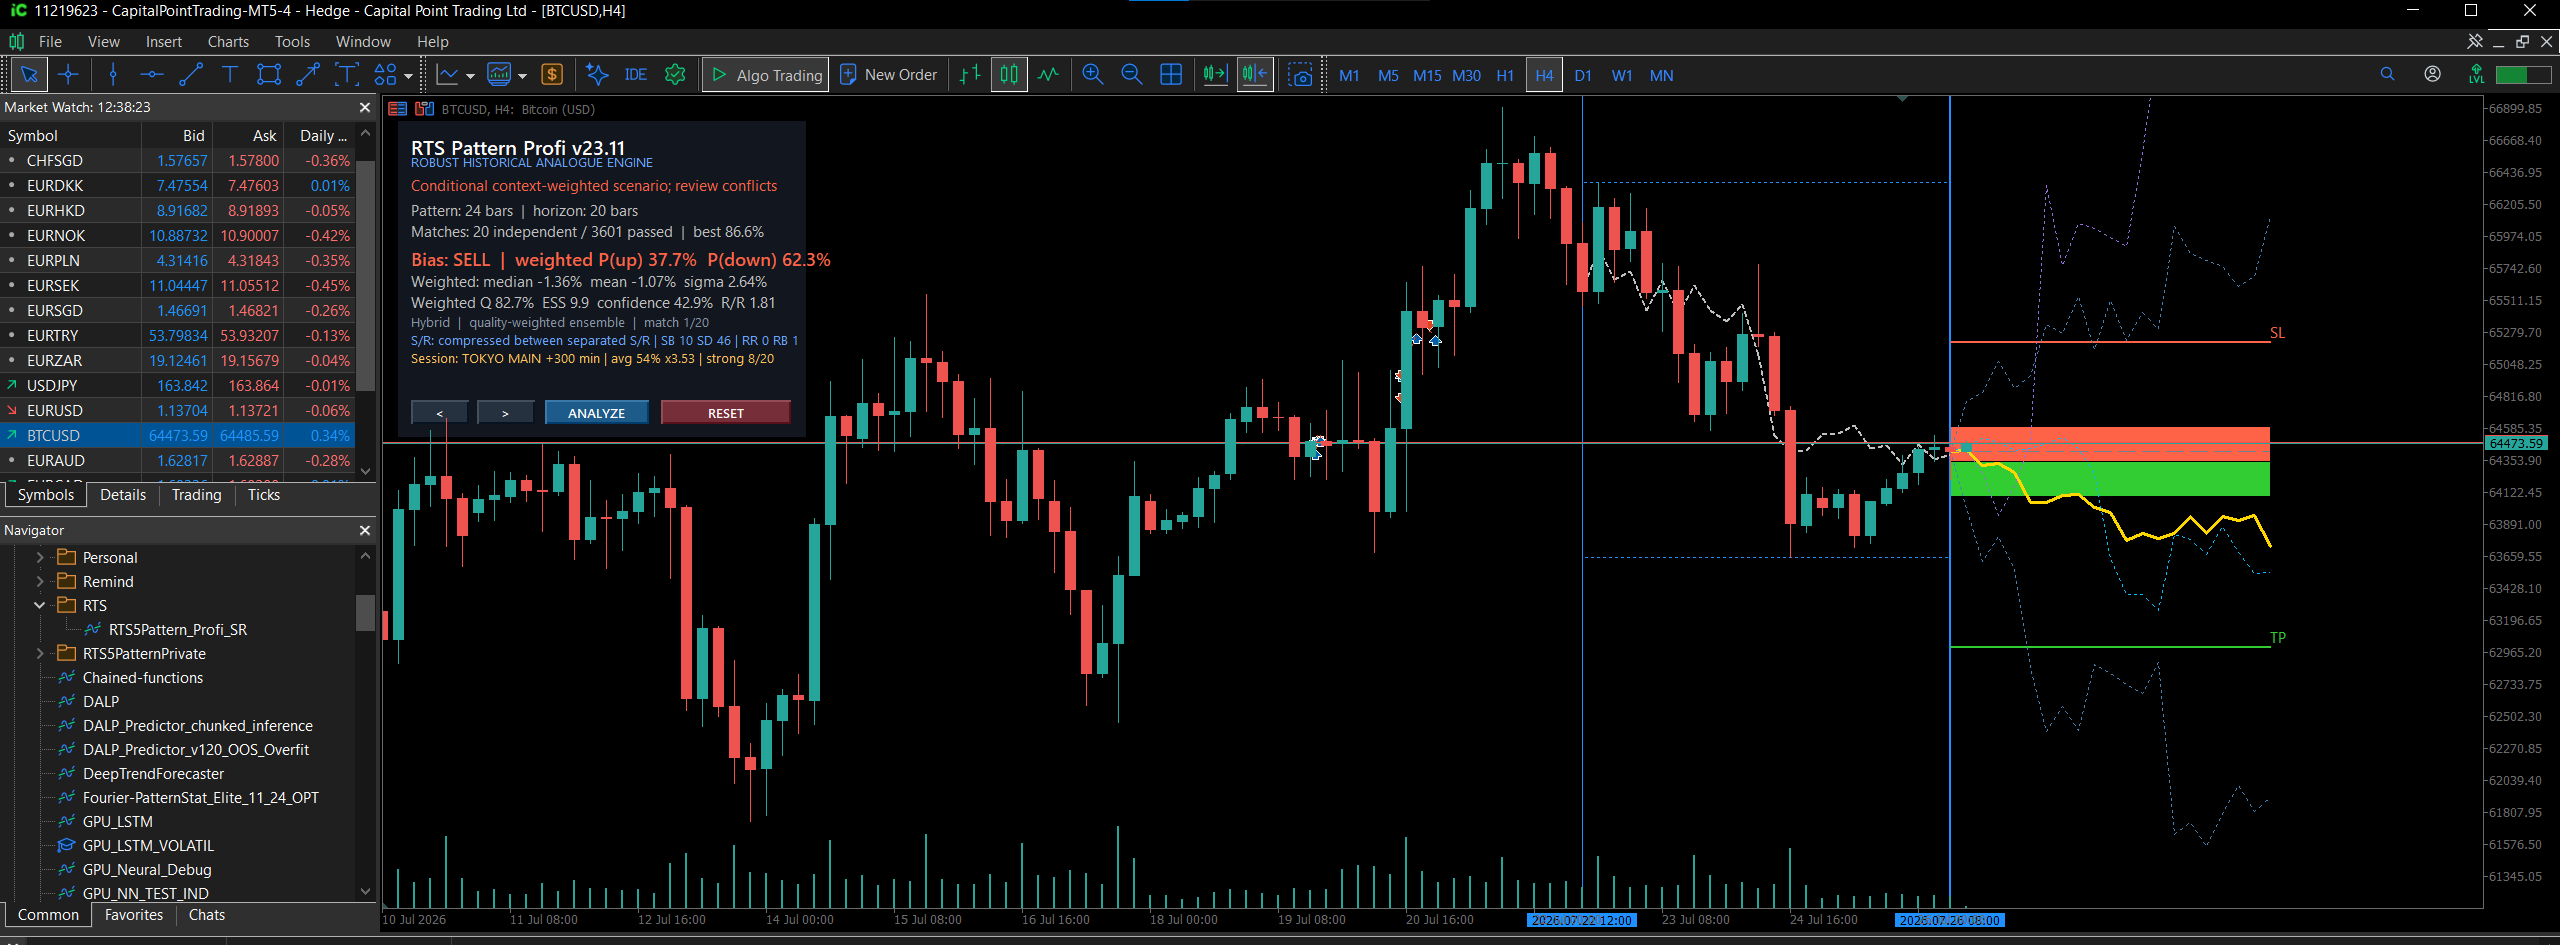
The interface remains visible—with corrected interpretation.
The screenshot documents the tested v23.11 instrument. Labels shown inside the historical capture are preserved,
but the published findings above supersede any implication that its percentages are calibrated forecasts.
Historical interface capture · BTCUSD H4 · v23.11Research example only · not a recommendation
Project policy
No pricing. No performance promise. Open findings.
All commercial plans and paid upgrade paths have been removed. Future work is organised as research:
hypotheses are written first, tests are reproducible, and negative results remain public.
Free
no paid indicator tiers
Access, if distributed, is for education, review and reproducibility—not as a paid signal product.
Transparent
negative evidence stays visible
Updates will not erase earlier failures. New models will be reported as separate versions and tests.
Falsifiable
clear gates before conclusions
Calibration, independence, costs and time stability must all pass before any stronger claim is considered.
Questions
Clear answers after validation.
Is RTS Pattern Profi a profitable trading system?
The published BTCUSD and EURUSD evidence does not support that claim. It should not be used as a standalone trading system.
Are P(up) and P(down) real probabilities?
Not on the tested configuration. They are weighted historical analogue outcome shares and were not calibrated to realised market frequency.
Why publish a failed result?
Because a negative result protects users, prevents unsupported marketing and provides a valid foundation for better research.
Is the indicator still sold?
No paid plans are offered on this page. The project is presented as non-commercial research.
Can a future version work?
Possibly, but it would require a new, pre-specified model and fresh out-of-sample validation. It cannot inherit credibility from the current results.
Who performed the validation?
This is an internal research validation by the project author, not an independent third-party audit. That distinction is part of the disclosure.
Evidence over sales
The honest conclusion is more important than the original product idea.
RTS Pattern Profi did not meet the required validation gates. The project therefore continues, if at all,
as an open investigation of why historical similarity fails and what a genuinely testable forecasting model would require.