RTS5Pattern is a professional indicator for the MetaTrader 5 platform, created specifically for Price Action traders who value clean charts and the critical importance of S/R levels. This tool combines the simplicity of Price Action with smart analysis of recurring price structures. It is designed to quickly and accurately identify price patterns in important contexts – without cluttering the chart with unnecessary indicators.

Why RTS5Pattern for Price Action traders? Because every pattern tells a story.
- No oscillators, MAs, or complex formulas needed – everything is based on raw price, candles, and market structure.
- Context-focused detection: Click the beginning and end of a pattern near a key S/R level. The indicator searches history and finds similar market situations – and shows you how price reacted back then.
- S/R relevance: Works excellently for bounce tests, false breakouts, returns to equilibrium, or breakouts from consolidation.
What can RTS5Pattern do?
- Pattern detection based on trader selection: Gives you full freedom – you define which candles make up a significant pattern (e.g., pin bar, engulfing, or three-candle reversal).
- Instant historical comparison: Instantly compares your setup to similar historical cases and shows how price developed afterward.
- Prediction of possible move: Shows likely direction and TP/SL levels based on past pattern outcomes.
- Clean chart output: Everything is drawn delicately with a focus on clarity – indicator output doesn’t block candles, but complements them.
What do you gain?
- Backtesting your Price Action patterns in real historical context.
- Decision support – determine if the pattern has a strong enough precedent.
- Evaluate pattern strength by how the market behaved after a similar structure in the past.
- High accuracy without overfitting – no curve fitting or overtrained models.
Recommended usage for Price Action S/R style
- Prepare your chart – recommended timeframes: M15 to H4. Remove all unnecessary indicators. Mark important support and resistance zones.
- Identify a visually interesting pattern in the S/R zone, e.g.:
- pin bar testing support,
- strong rejection after breakout,
- reversal engulfing right under resistance.
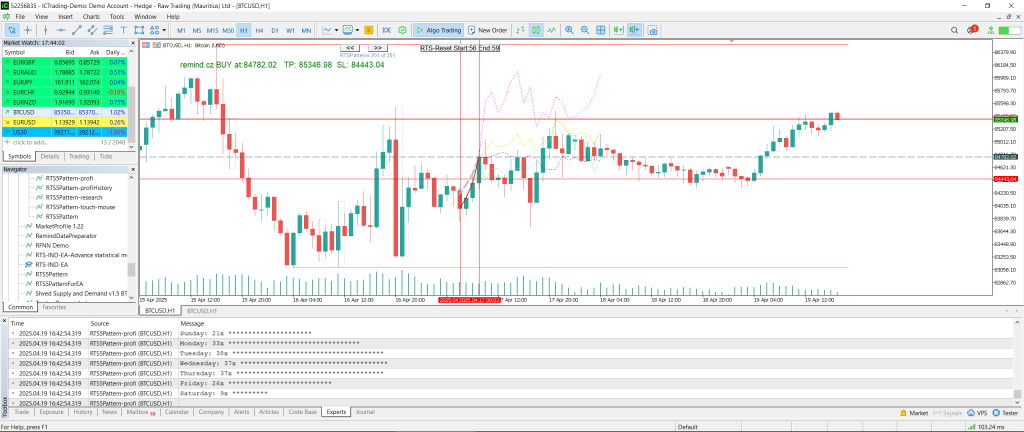
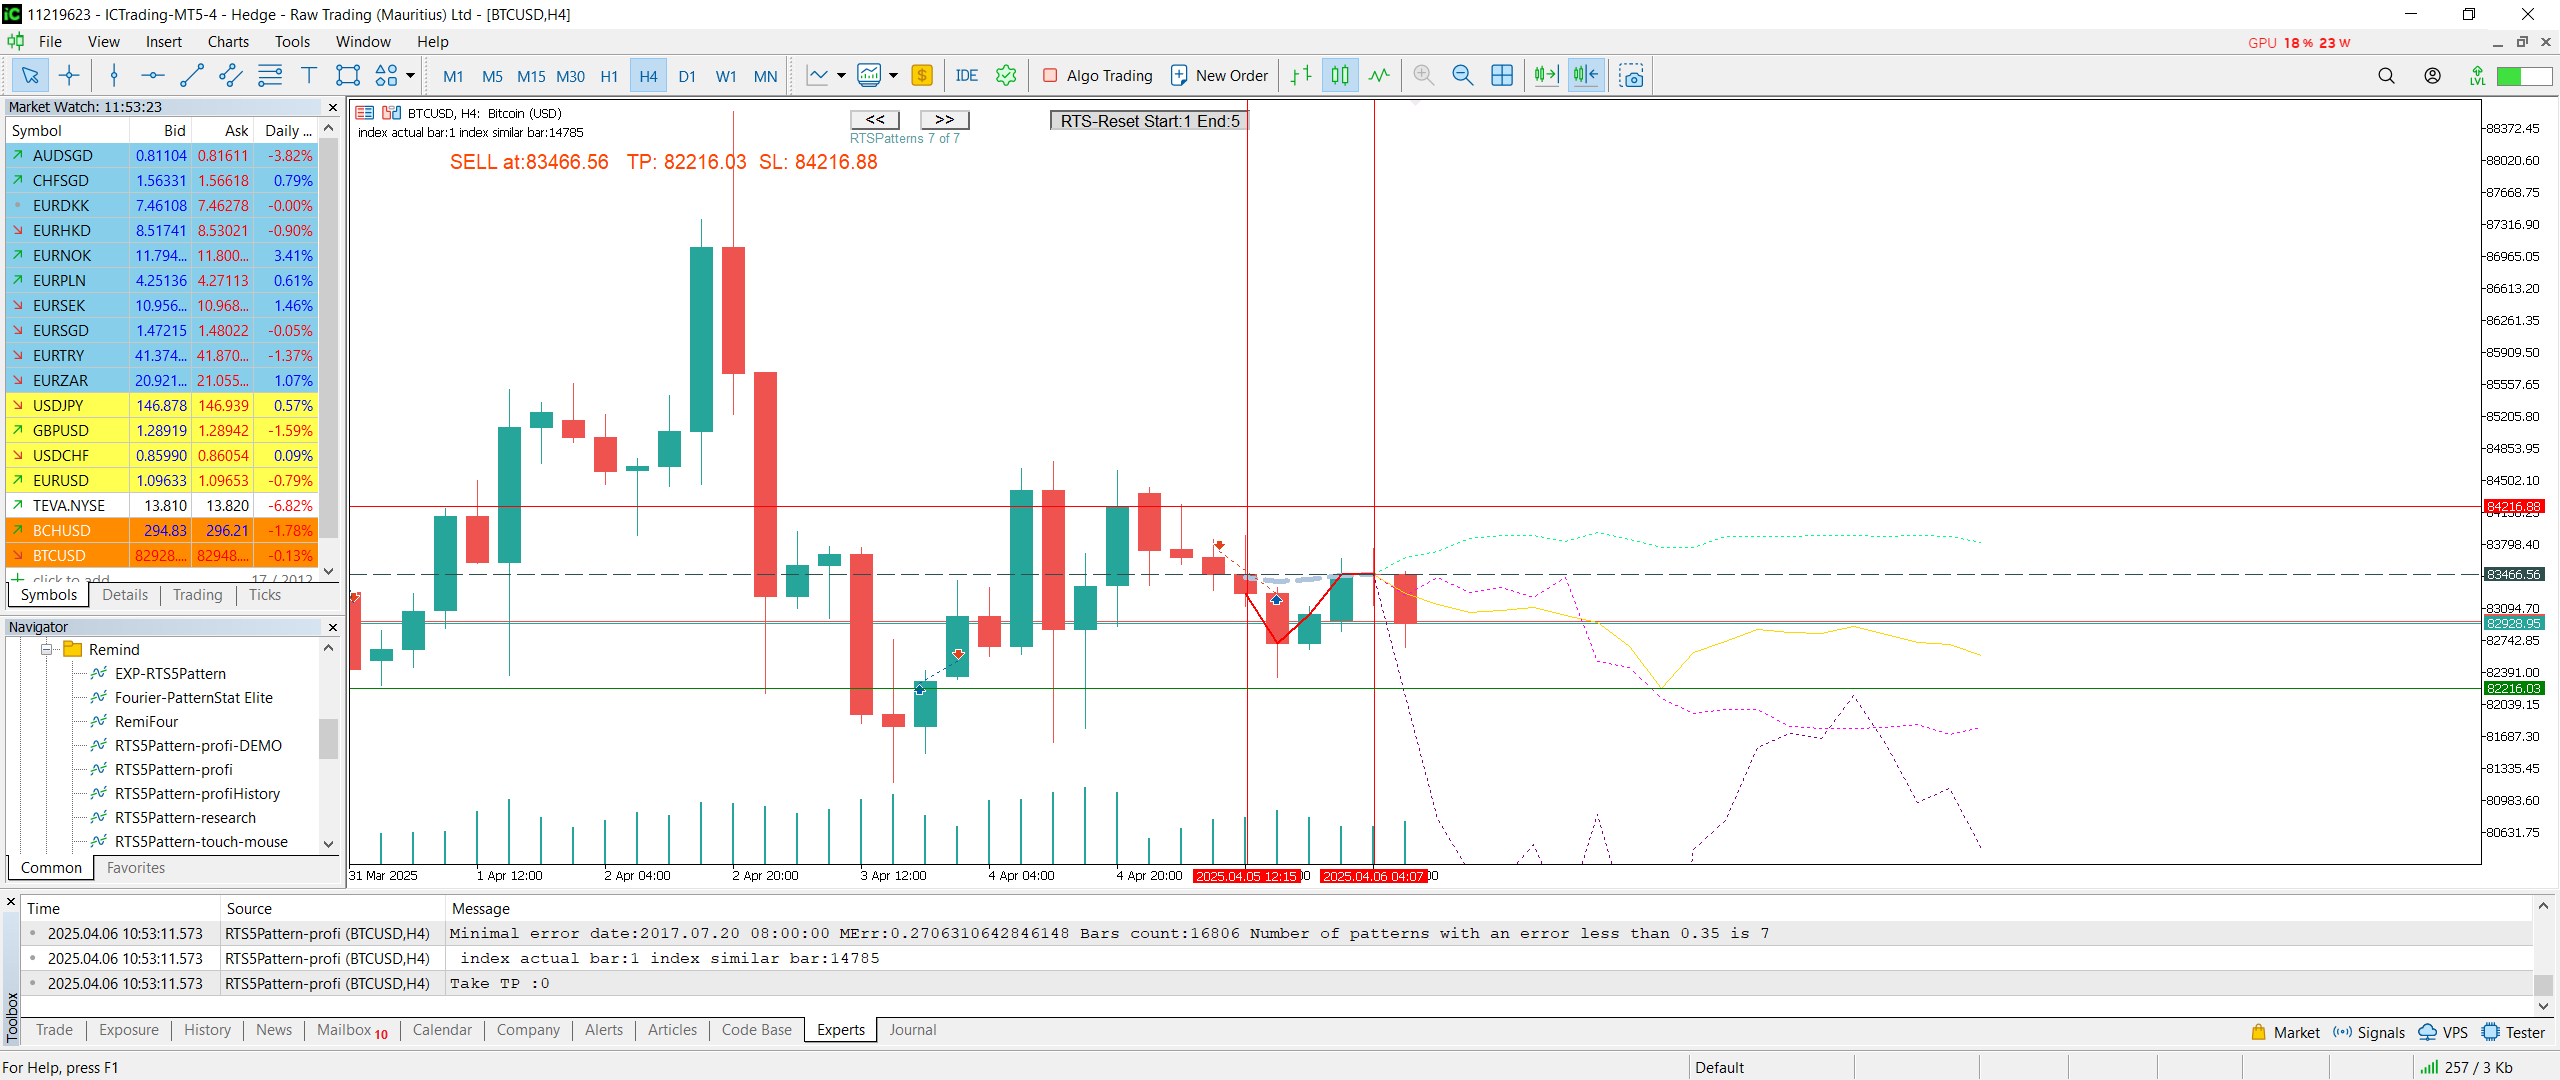
- Click on the first and last candle of the pattern – this provides the indicator with a sample. It will scan the entire history and find closest matches.
- Watch the prediction – the chart will show three closest historical matches with likely price trajectories. The yellow line shows the dominant direction (aggregated).
- Make decisions based on context:
- If the pattern has been historically stable and price moved directionally (clear TP far from entry), the indicator confirms your idea.
- If results are inconsistent or lack strong matches, the entry might not be ideal.
- Use it for confirmation, not as an automatic entry signal. RTS5Pattern is not a „buy/sell“ indicator but a tool to validate your Price Action-based trade decisions.
RTS5Pattern is the perfect tool for any trader working with Price Action and classic support/resistance levels. It helps traders quickly and effectively verify whether a visually identified pattern has historical support and provides context for anticipating future price movement.

Author: Tomáš Bělák