
Introduction
RTS5PatternBTCPrice is an analytical tool for MetaTrader 5 that systematically searches for historical similarities in price action and evaluates how the market behaved after similar situations.
The indicator provides both visual and statistical information that can be used to support trading decisions.
It compares the current price pattern, defined by a selected number of candles, with historical data.
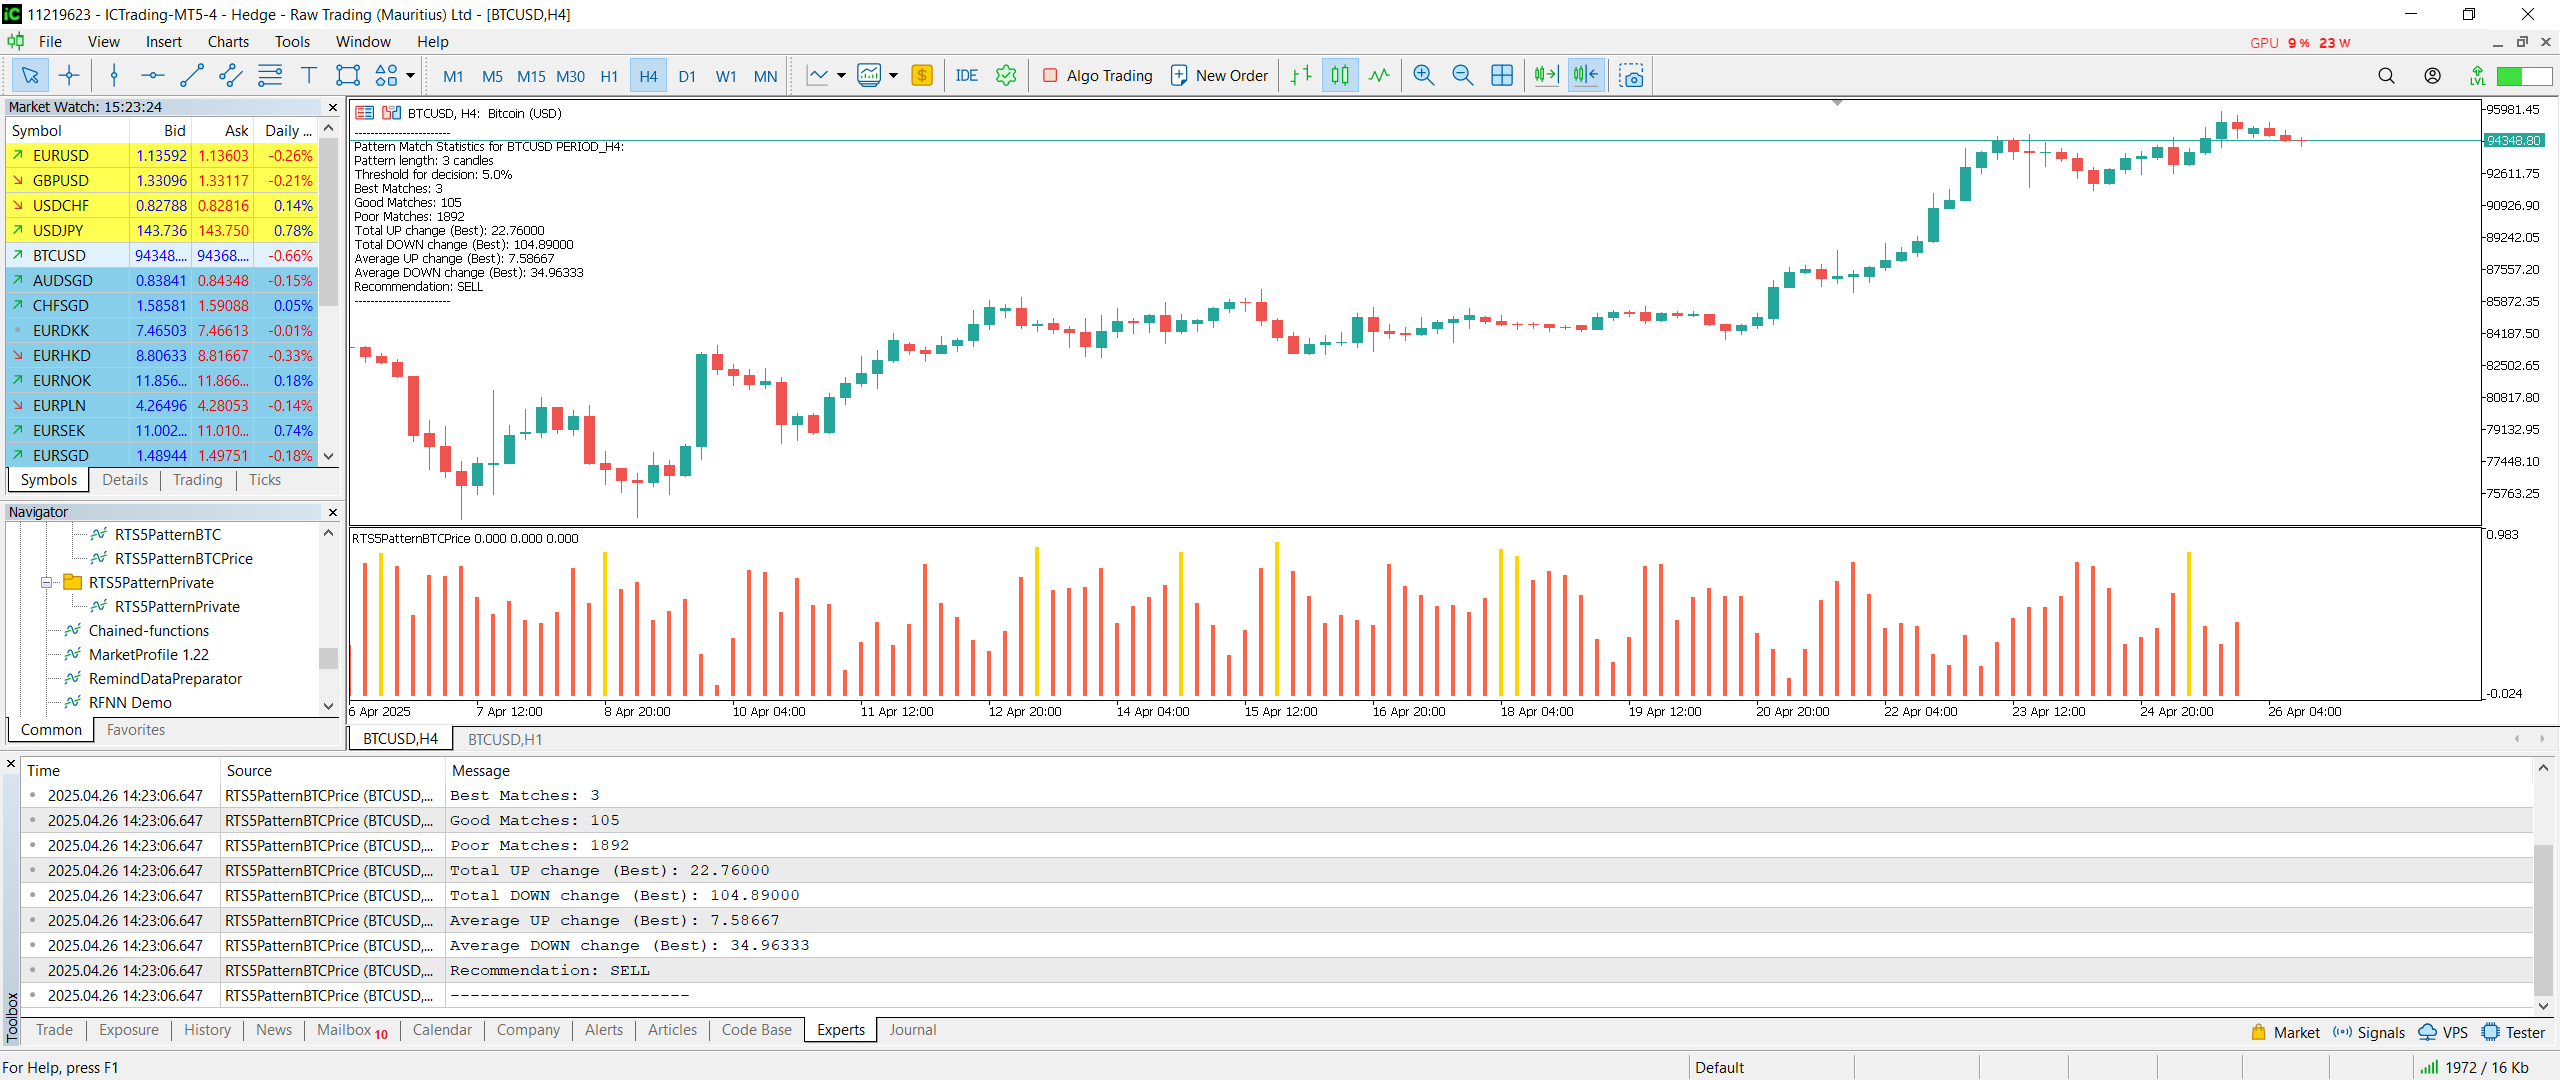
The similarity results are displayed using a histogram with three categories:
- Good Match – high similarity (green color),
- Average Match – medium similarity (yellow color),
- Poor Match – low similarity (red color).
The higher the histogram bar, the greater the similarity detected between the historical pattern and the current market situation.
How the Histogram Works
The histogram shows the degree of similarity between the current market setup and past price patterns within a defined historical window (for example, 2000 bars back).
Each bar in the histogram represents one historical pattern and its similarity to the current setup.
Bars are color-coded based on the achieved similarity level, allowing quick visual orientation.
The histogram itself does not predict market direction; it simply measures how often similar patterns have appeared in the past.
The Role of Statistics
In addition to visual analysis, the indicator provides detailed statistics based on the evaluation of the best-matching patterns:
- It calculates the total and average price change upwards and downwards after similar historical patterns.
- Based on the difference between average upward and downward movements, the indicator offers a trading recommendation:
- BUY – if historical cases predominantly led to upward movements,
- SELL – if downward movements prevailed,
- STOP – if no significant bias was identified.
The recommendation is purely statistical and should not be interpreted as an automatic trading signal.
How to Use the Indicator
- Setting Parameters
Users can configure the pattern length (number of candles), the historical range to scan, and the prediction window length.
It is advisable to select parameters that suit the timeframe and nature of the traded instrument. - Analyzing the Histogram
The histogram displays how many matches were found and how strong they were.
When several Good Matches are identified, it indicates that the current market setup has historical precedents. - Interpreting the Statistics
The statistical output shows how the market tended to behave after similar setups.
If the average upward movement is significantly larger than the downward movement, this can be considered when planning a long (buy) position. - Using the Recommendation
The recommendation (BUY / SELL / STOP) is an auxiliary piece of information.
It should be used alongside other forms of market analysis, such as price action, trend identification, or fundamental considerations. - Risk Management
As with any historical analysis, it is important to remember that past performance does not guarantee future results.
Outputs from the indicator should be incorporated into a broader risk management and trading plan.
Summary
RTS5PatternBTCPrice offers a structured view of how similar price setups evolved historically.
It is designed to serve as a source of clear, unbiased information, providing traders with a calm and objective foundation for their market analysis.
The indicator does not replace the trader’s decision-making but creates a framework for incorporating historical insights into a systematic trading approach.

RTS5PatternBTCPrice is an analytical tool for MetaTrader 5 that systematically searches for historical similarities in price action and evaluates how the market behaved after similar situations.
The indicator provides both visual and statistical information that can be used to support trading decisions.
It compares the current price pattern, defined by a selected number of candles, with historical data.
The similarity results are displayed using a histogram with three categories:
-
Good Match – high similarity (green color),
-
Average Match – medium similarity (yellow color),
-
Poor Match – low similarity (red color).
The higher the histogram bar, the greater the similarity detected between the historical pattern and the current market situation.

Author: Tomáš Bělák