
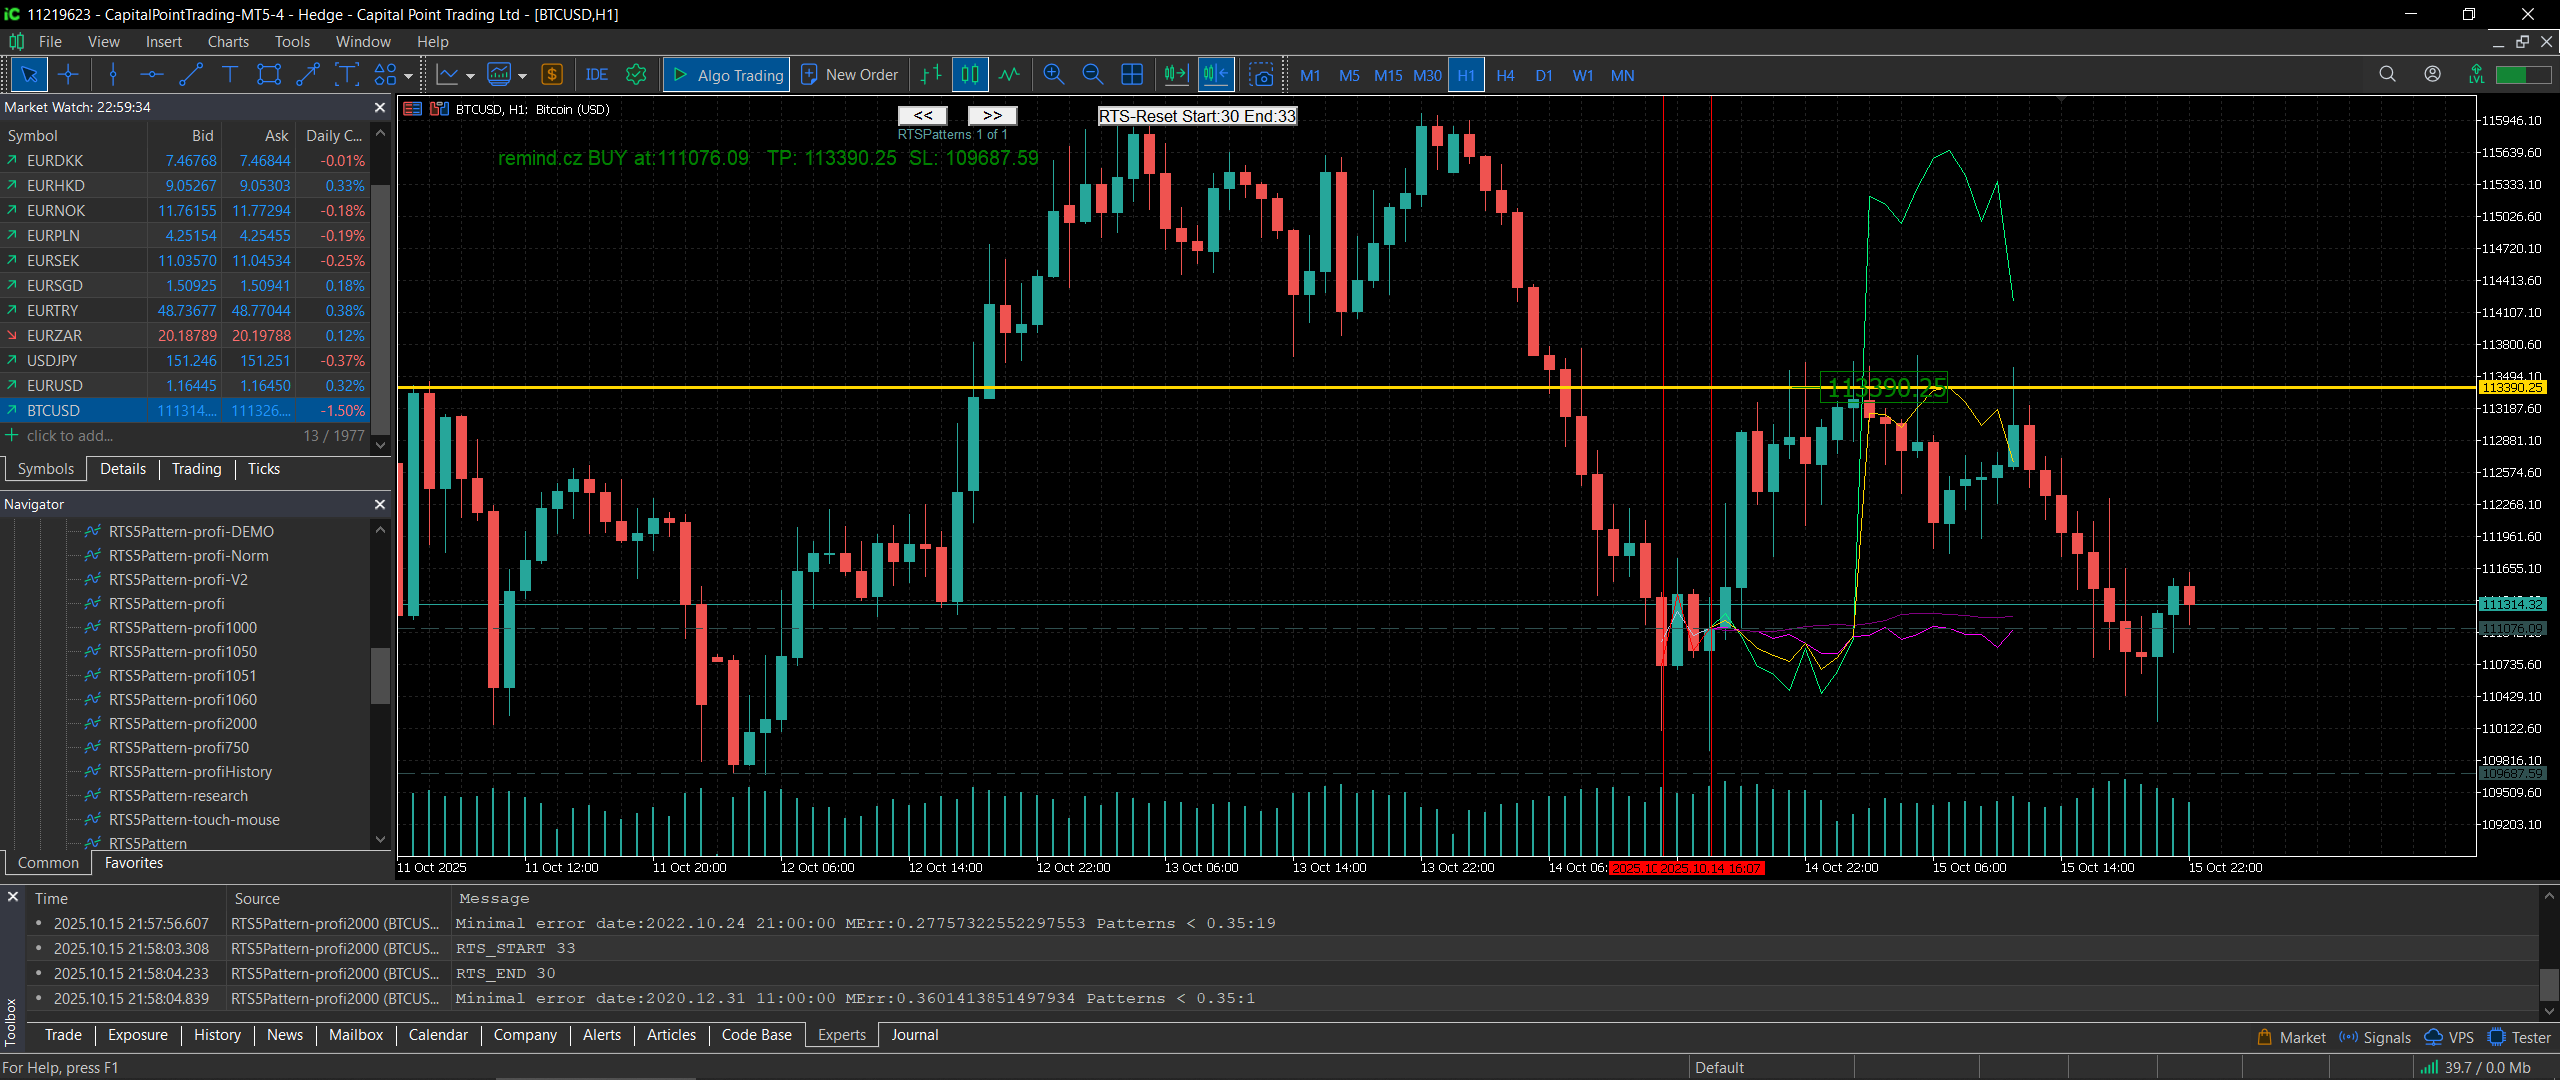
RTS5Pattern-profi v20.00 is an interactive pattern-matching indicator for MetaTrader 5. Select any price segment on the chart (first and last candle), the tool searches historical windows for the closest matches, projects their continuations, and proposes ENTRY, TP, and SL with clear on-chart visuals. Workflow remains click-to-analyze, fully integrated with the chart.
| Area | Version 10.50 | Version 20.00 (Current) |
|---|---|---|
| Language & UX | Mixed CZ/EN texts | Full English texts & labels, consistent UX |
| Time anchor & repaint | Basic redraw | Stable time-anchor (repaints segment reliably) |
| Top matches | Top-3 drawn initially | Top-3 stored in ERR_TOP and reused for repaint |
| AStat calculation | Weighted mean | Weighted mean with EMPTY_VALUE safety guards |
| Pattern similarity | OHLC min–max normalization | Same core logic; code streamlined for clarity |
| TP/SL hit test | M1 comparison | Precise M1-based order check (TP vs SL) with markers |
| Object lifecycle | Occasional residue | Consistent cleanup (lines, labels, vertical markers) |
| Controls | Buttons & label | >> / << navigation, Reset RTS, status label |
| Performance | Optimized vs 7.50 | Same footprint; predictable runtime on ≥1000 bars |
| License / expiry | Various dates | Time-lock enforced in OnInit & OnCalculate — valid through 31 Dec 2025 |
Core Functionality
- Pattern Selection — Click the first and last candle to define the reference pattern.
- Similarity Search — Normalized OHLC differences across historical windows (optional volume penalty).
- Projection Generation — Three candidate paths (Predict, Predict1, Predict2) + AStat consensus.
- Trade Proposal — Automatic ENTRY/TP/SL plotted on chart; M1-based hit order (TP vs SL).
- Navigation — Browse matches with
>>/<<, reset selection with Reset RTS.
Inputs
| Parameter | Description |
|---|---|
| PredictionLen | Forward projection horizon (bars). |
| VolumeCalculate | Include volume differences in similarity error. |
| MSQErr | Maximum error threshold for accepting a match. |
| Plot | Toggle graphical output. |
Outputs & Objects
- Predict, Predict1, Predict2 — Candidate projection curves.
- AStat — Weighted consensus (safe handling of missing points).
- Load — Visual reconstruction of the selected pattern vs best match.
- ENTRY / TP / SL — Horizontal levels with labels and hit markers.
- RTSPatternsLabel — “current / total” match indicator.
License and Time Restriction
RTS5Pattern-profi v20.00 is licensed for use until 31 December 2025 (inclusive). Time-lock is enforced in initialization and runtime. After expiry, the indicator displays a notice and stops. For extensions, contact Remind.cz.
Who is it for? Traders using price action and classical S/R who want historical validation for visually spotted patterns and a
consistent, on-chart projection workflow.
Why Analog-Based Pattern Analysis Beats “Indicator-Only” Trading
Executive Summary
Analog-based pattern analysis searches large price histories for segments that look like the one you’ve just selected and projects what typically followed. Done well, it turns subjective price-action reading into evidence-based decision making. The edge comes from three realities: (1) markets often recycle structure across regimes, (2) volatility and microstructure generate recurring motifs, and (3) humans respond to similar contexts in predictable aggregates. The output is not a single path but a distribution—letting you size trades based on probability and expectancy, not hunches.
1) What “analog” pattern analysis is (and isn’t)
Is: A systematic search for historical look-alikes of a user-defined pattern; a projection of future outcomes derived from the continuations of those look-alikes; a way to quantify P(TP before SL) and expected value (EV) for concrete trade planning.
Isn’t: Curve-fitted astrology or a generic indicator mash-up. It doesn’t predict the future deterministically; it conditions your decision on the closest available historical evidence.
2) Why the approach can work
- Structural recurrence: Market participants recycle behavior around liquidity pockets, session boundaries, and risk events. Price compressions, breakouts, and mean-reversions recur with similar shape even if absolute price levels differ.
- Path dependence: Order flow and inventory dynamics produce local path similarities (squeezes, pullbacks, failed breaks).
- Regime persistence: Trends and vol regimes often persist long enough that short-term analogs carry information about near-term odds.
3) The critical shift: from a single “call” to a distribution
Traditional indicators emit a binary or scalar signal. Analog analysis yields a set of plausible futures. From the top-K matches you can compute:
- Median Path (P50) and Uncertainty Bands (P10 / P90)
Probability of Target before Stop: P(TP < SL)
Expected Value (EV):
EV = Σ (wᵢ × Rᵢ), where weights wᵢ are proportional to exp(−λ × errorᵢ),
and Rᵢ is the R-multiple derived from the continuation of each analog.
This lets you optimize TP/SL and position size based on objective odds.
4) Advantages vs. indicator-only and black-box ML
Compared to indicator-only:
- Context awareness: Uses the entire local path (shape), not just pointwise indicator values.
- Scenario thinking: Quantifies multiple futures instead of betting on one.
- Decision auditability: You can show the exact historical analogs that informed the trade.
Compared to black-box ML:
- Transparency: No opaque feature engineering; similarity and outcomes are inspectable.
- Data efficiency: Works well with modest data and non-stationarity; less reliant on stable labels.
- Robustness to drift: Re-runs similarity on current data rather than trusting a static model fit months ago.
5) Measuring “similarity” the right way
Even a basic setup (normalized OHLC with optional volume) beats eyeballing, but precision improves with:
- Return-space normalization: Use log returns and Z-scores to reduce scale effects.
- Time alignment: Allow small warps (e.g., DTW with a band) to tolerate tempo differences.
- Multi-channel features: Combine close-returns, wick/real-body ratios, and ATR structure; weight channels.
- Affine fit on overlap: Small gain+offset alignment stabilizes projections without overfitting.
- Regime penalties: Down-weight analogs from different trend/volatility regimes.
(Your current EN v20.00 uses normalized OHLC plus optional volume and a stable repaint via time anchor; these fundamentals already deliver practical value. The above ideas are incremental upgrades if/when you want more precision.)
6) Turning analogs into trades
A disciplined workflow:
- Select pattern (first → last candle).
- Collect top matches; compute continuation curves.
- Form AStat (weighted consensus) and uncertainty band.
- Compute P(TP before SL) and EV over a TP/SL grid.
- Choose the pair (TP, SL) maximizing EV under your risk constraints (e.g., cap SL distance, ensure P(TP) ≥ threshold).
- Validate context (trend alignment, S/R, news risk).
- Execute and monitor; use the pre-computed expected time-to-hit for managing patience vs. opportunity cost.
7) Risk management: from odds to size
- R-multiple framing: Compare EV across setups independent of instrument volatility.
- Kelly-lite: If ppp is calibrated and edge is small, size a conservative fraction of Kelly to control drawdowns.
- Vol-aware SLs: If projections span a wide band, widen SL but reduce size to keep risk per trade constant.
- Portfolio view: Prefer setups with uncorrelated analog contexts to avoid clustered losses.
8) Validation and reliability
- Walk-forward evaluation: Freeze your similarity settings, replay history, and collect out-of-sample results.
- Hit-order truth: Always check which came first on a finer timeframe (e.g., M1) to avoid bar-aggregation bias.
- Calibration: Adjust the weighting temperature λ\lambdaλ so that predicted probabilities match observed frequencies (reliability).
- Leakage control: Exclude any future bars from the similarity window; anchor strictly to the user’s end bar.
9) When to stand down
- Regime breaks and macro events: CPI, NFP, rate decisions, earnings—history can be a poor guide during shocks.
- Illiquid sessions: Thin books deform analog continuity.
- High divergence: If top-K futures disagree wildly (wide band, multimodal outcomes), skip or reduce risk.
10) Performance considerations
- Shortlisting: Pre-filter candidates with cheap metrics (e.g., downsampled returns) before detailed comparison.
- Window lengths: Keep pattern length meaningful (15–40 bars is a good starting band).
- Caching: Reuse computed errors when panning/zooming; store top-K indices for stable redraw (as your v20.00 does).
- Complexity vs. latency: Add sophistication (e.g., DTW) only if it materially improves out-of-sample performance.
11) Practical checklist before entry
- Pattern length is sufficient and context-relevant.
- Top analogs are plausible on visual inspection (no regime mismatch).
- AStat aligns with higher-timeframe bias or S/R context.
- P(TP≺SL)P(\text{TP} \prec \text{SL})P(TP≺SL) and EV are above your cutoffs.
- TP/SL are practical (not inside obvious liquidity or micro-noise).
- News calendar clear; liquidity normal.
12) Frequently asked questions
Q: Isn’t this just curve fitting to history?
A: Only if you over-tune similarity and ignore out-of-sample checks. With fixed rules and walk-forward validation, you’re conditioning on empirical frequencies, not fitting parameters to maximize past PnL.
Q: What if two analogs conflict?
A: That is information—dispersion signals uncertainty. Either pass or cut size. Systems fail when they force conviction where the data shows ambiguity.
Q: Why not just use an LSTM or transformer?
A: You can—but analog methods offer interpretability, lower maintenance, and resilience to regime drift. If you later add ML, feed it analog features (error ranks, dispersion, regime flags) to boost signal quality.
Q: Does volume matter?
A: Sometimes. Include it as a soft penalty, not a hard filter, to avoid discarding good price analogs when volume data is noisy or broker-specific.
Closing
Analog-based pattern analysis won’t predict the future; it prices it—by showing the range of likely paths and their frequencies. That shift—from a single opinion to a distribution with calibrated odds—is the core advantage. It lets you trade expectancy, not anecdotes; process, not impulse.
RTS5Pattern-profi
RTS5Pattern-profi is an interactive pattern-matching indicator designed for statistical price projection in MetaTrader 5.
By selecting any price segment directly on the chart, the indicator scans historical data for similar formations,
reconstructs their subsequent movement, and generates a probabilistic outlook with automatically derived ENTRY, TP, and SL levels.
It offers an intuitive click-to-analyze workflow without altering the trading interface.
Core Functionality
- Pattern Selection — Click the first and last candle of a price segment to define the reference pattern.
- Similarity Search — The system measures normalized OHLC differences (optionally including volume) across historical windows.
- Best Match Extraction — Top matches are identified according to the minimum mean-squared error criterion.
- Projection Generation — Each match provides a continuation curve; the weighted mean (AStat) represents the main prediction.
- Trade Proposal — ENTRY, TP, and SL are calculated automatically and plotted on the chart, including hit-test logic (TP vs SL).
Key Features
- Interactive pattern detection with time anchoring for stable redrawing.
- Multiple projection curves (Predict, Predict1, Predict2) plus AStat consensus line.
- Auto-computed ENTRY, TP, SL with visual trade markers.
- Navigation between pattern matches (
>>/<<buttons) and reset function. - Safe redrawing mechanism tied to the original selection timestamp.
Input Parameters
| Parameter | Description |
|---|---|
| PredictionLen | Number of bars used for forward projection. |
| VolumeCalculate | Enables inclusion of volume differences in similarity calculation. |
| MSQErr | Maximum allowed error threshold for accepting a match. |
| Plot | Enables or disables graphical output. |
Output Buffers and Objects
- Predict, Predict1, Predict2 — Candidate projection curves.
- AStat — Weighted composite of the top projections.
- Load — Visual reconstruction of the input pattern.
- ENTRY, TP, SL — Horizontal levels plotted on chart.
- TP_hit / SL_hit — Markers indicating which level was reached first.
- RTSPatternsLabel — Shows current match index and total count.
- Buttons:
>>,<<, andReset RTSfor browsing and control.
Recommended Use
- Select patterns between 15–40 bars for best statistical consistency.
- Use AStat as the main projection, but verify alignment with the broader trend.
- Always validate TP/SL against current support-resistance zones.
- Avoid entries when multiple projections diverge significantly.
Performance and Compatibility
- Compatible with all MetaTrader 5 symbols and timeframes.
- Requires sufficient historical data (≥ 1000 bars).
- Slightly increased computation time when volume comparison is enabled.
License and Time Restriction
- Licensed for use until 31 December 2025 (inclusive).
- After this date the indicator disables itself and displays a license notice.
- For license extension or commercial use, please contact Remind.cz.
Professional Note
RTS5Pattern-profi provides a statistical projection, not a trading signal guarantee.
The generated TP/SL levels are suggestions derived from historical analogies and should be validated by the trader’s
own strategy, risk profile, and money management.
Author: Tomáš Bělák