
User Manual – Fourier-PatternStat Elite (MT5 Indicator)
Version 1.00 — Copyright © 2023 Tomáš Bělák
1. Overview
The Fourier-PatternStat Elite is a predictive indicator for MetaTrader 5 that analyzes historical price data using mathematical wave decomposition. By identifying repeating market structures, it aims to forecast short-term price developments based on harmonic modeling derived from Fourier transformation.
2. Installation
- Copy the indicator file into your MetaTrader 5
Indicatorsdirectory. - Restart MetaTrader 5 or refresh the Navigator.
- Apply the indicator to any chart.
- Set your desired configuration in the indicator’s input dialog.
3. Configuration Overview
You can tailor the indicator’s behavior to your strategy by adjusting the following:
- Historical Depth
Define how much historical price data will be used for pattern recognition. Longer history provides a broader analytical base. - Model Detail
Set the number of harmonic components used to approximate market cycles. A higher count yields smoother predictions but increases computation time. - Forecast Horizon
Choose how far ahead the indicator should project potential price movements. - Start Point Selection
Click on any candle in the chart to simulate a forecast from that historical point. This feature is useful for testing predictability in past conditions. - Price Type
Select the basis for calculation: open, close, high, low, or median price of each candle. - Internal Precision
The indicator automatically handles calculation accuracy. In most cases, default settings are sufficient.
4. Visual Outputs
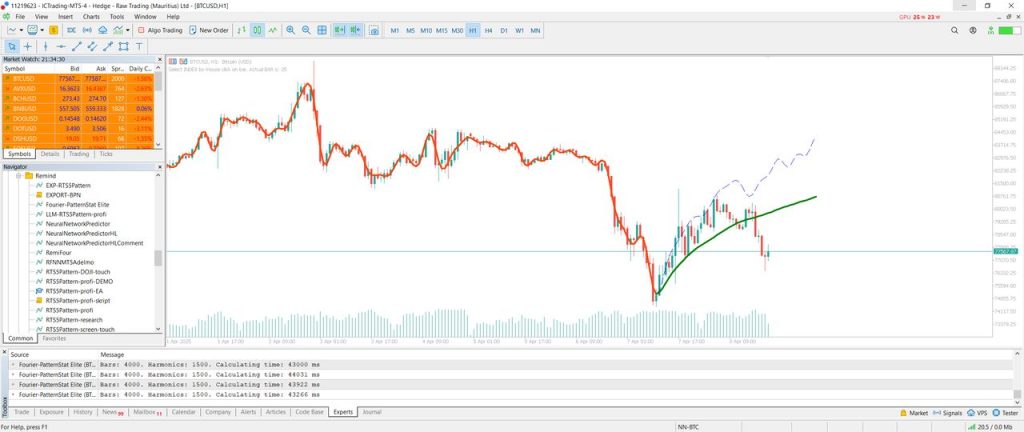
After configuration, the indicator displays three visual elements directly in the chart:
- Historical Input Line (usually in blue): represents the analyzed price data.
- Extrapolated Prediction Line (orange/red): shows the projected pattern based on harmonic continuation.
- Smoothed Forecast Curve (green): displays an averaged projection vector intended to reduce noise.
5. How to Use Effectively
- Use the click-to-select function to test prediction reliability in past bars.
- Adjust the history depth and model complexity to balance speed and detail.
- Observe where the extrapolated and smoothed lines converge or diverge — this may signal potential price direction changes.
- Combine the indicator output with classic technical tools like support/resistance, trendlines, or oscillators.
- Use in demo mode first to gain confidence in interpreting the outputs.
6. Risk Management
As with any predictive tool, forecasts are probabilistic — not guaranteed. You should:
- Always use stop-loss and take-profit mechanisms.
- Avoid relying on this indicator in isolation.
- Be aware of news and fundamental events that may override technical patterns.
7. Recommended Use
This indicator performs best when used on trendless or cyclic markets, particularly in sideways phases where harmonic structures repeat more clearly. It is ideal for:
- Short-term forecasting (intraday to a few days).
- Strategy validation through historical replay.
- Confirmation tool in a multi-indicator system.
- Use with price-action or mean-reversion strategies in ranging markets.
For directional markets or news-driven spikes, use this indicator as a complementary filter, not a primary signal.

Author: Tomáš Bělák
Welcome