
This trading plan describes the use of the professional RTS5Pattern indicator when trading Bitcoin (BTC) in two different styles. The first part focuses on short-term intraday trading (scalping) for small trading accounts up to 500 USD on low timeframes (M1, M5, M15). The second part presents a long-term swing strategy for larger accounts over 2000 USD on higher timeframes (H4, D1). The plan includes recommended settings for the RTS5Pattern indicator, methods for identifying patterns and entering trades, risk and position management, filtering false signals, specific sample scenarios and automation options (EA). Finally, recommendations for managing multiple parallel trades or markets are given. The entire strategy emphasizes Price Action and support/resistance levels (S/R), as the RTS5Pattern indicator is designed for these approaches.
Short-term strategy (accounts up to $500, low TF)
For smaller trading accounts (up to $500), it is advisable to focus on short-term trades using low time frames such as 1-minute, 5-minute or 15-minute charts (M1, M5, M15). This intraday/scalping strategy takes advantage of fast price movements and frequent trading opportunities throughout the day. The goal is to achieve smaller profits per trade, but with higher frequency, while strictly managing risk. The individual aspects of this strategy are discussed below.
Setting up the RTS5Pattern indicator for scalping
- Timeframe and usage : Although the indicator author recommends timeframes from M15 upwards, in this short-term strategy RTS5Pattern can also be used on M5 or M1 charts for very fast trades. The indicator is optimized for fast scanning even on low TFs (e.g. M5) in a volatile BTC environment. However, be careful when using it on M1 – very short periods can generate a lot of noisy patterns.
- Recommended parameters:
- PredictionLen (prediction length): For scalping, choose a shorter prediction length, for example ~10 candles ahead. This will make the indicator predict developments only in the near term, which corresponds to quick closing of positions.
- MSQErr (pattern error tolerance): On lower TFs, price development can be more volatile, so you can set a slightly higher error tolerance (e.g. 0.3 to 0.5) to find a sufficient number of similar patterns in history. A higher MSQErr will include more historical analogies, although with less accuracy of matching. Conversely, a tolerance that is too low could mean that the indicator often does not find any matches on M1/M5.
- S/R and Inside Bar (IB): In the settings, enable the display of S/R levels and inside bars, if the indicator allows it. RTS5Pattern can automatically detect significant support/resistance zones (drawing them as transparent rectangles) and mark inside bar patterns. These functions will help filter signals in the context of scalping – for example, trade patterns only near significant intraday S/R levels or after consolidation (IB).
- Leave other parameters (if available, e.g. number of matches displayed, color selection, etc.) at default values or adjust according to your preferences for chart clarity. It is important to keep the chart clean, as the indicator author recommends – remove unnecessary indicators and let the price action and RTS5Pattern outputs stand out.
Pattern identification and trade entry (click logic)
- Pattern Selection: Watch the chart in real time and look for significant price patterns at important levels. On intraday charts, these will often be candlestick patterns such as pin bars, engulfing candles, double bottoms/tops on a one-minute chart, etc., which form around intraday support or resistance. It is advisable for such a pattern to be visually clear and, ideally, confirmed by increased trading volume – this signals that significant activity has taken place at a given price.
- Using the indicator (clicking): Once you have identified a potentially tradable pattern, use RTS5Pattern to evaluate it. The procedure is as follows: click on the first and last candlesticks of the given pattern on the chart. This will mark the specific section of the price movement that you are interested in for the indicator. RTS5Pattern will immediately search historical data and find the closest similar situations from the past (according to the specified error tolerance). The chart will display up to three historical analogous courses (typically plotted as dotted lines, e.g. pink or purple dashed lines) as well as an aggregated development forecast shown by a yellow curve , which represents the most likely direction of further price movement.
- Prediction Evaluation: Carefully look at how the price has historically behaved after the selected pattern. The indicator will show you whether such a signal has typically been followed by an increase, decrease, or no significant movement in the past. It will also display estimated Take Profit (TP) and Stop Loss (SL) levels based on these historical cases. For example, if most of the matches found led to a price increase of ~$100 and the maximum pullback was ~$50, the indicator may indicate a recommended TP level at a distance of $100 above the entry and a SL level of $50 below the entry. The yellow line shows the consensus trajectory – if it is significantly increasing or decreasing, it is a strong indication of direction. Conversely, a flat or zigzag yellow line indicates an ambiguous outcome.
- Entering the trade: Based on the indicator’s prediction and the context, decide whether to enter the trade. Trade only patterns that have clear historical support – i.e. the indicator has found several similar situations and the resulting direction (yellow trajectory) is consistent and significant remind.cz . It is ideal if the current market context also makes sense (e.g. the pattern is at a local bottom at support and the prediction shows a rebound upwards). Enter immediately after the pattern is completed (e.g. after the confirmation candle closes) so as not to miss the move. Do not trade if the indicator shows conflicting results (half matches up, half matches down) or if the pattern appears in an unclear environment (in the middle of a range without S/R). In such a case, filter the signal – it is better to skip it.
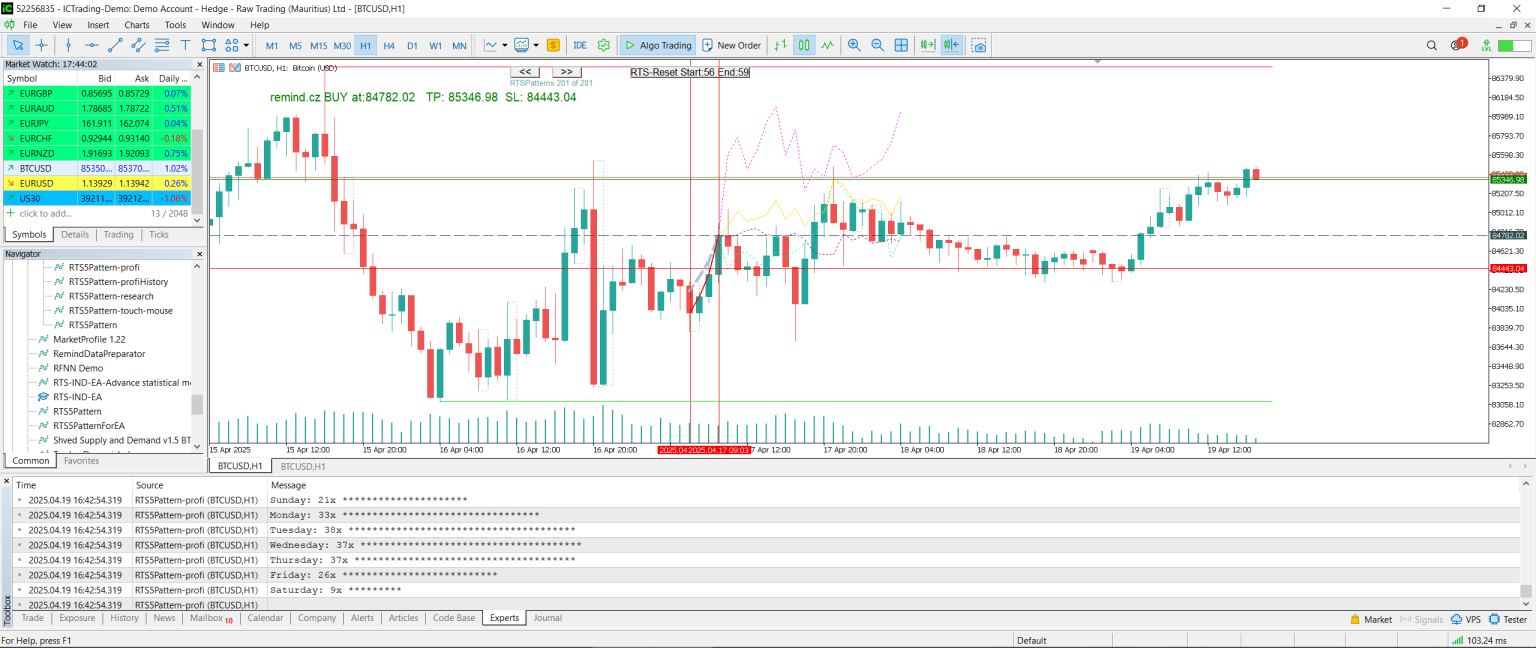
- Example of applying the RTS5Pattern indicator to BTC/USD (H1 chart). Vertical red lines indicate the selected pattern (beginning and end). The indicator then plotted three historical price movements corresponding to this pattern (dashed purple lines) and an aggregated direction prediction (yellow line). Potential SL (red line below price) and TP (green line above price) levels derived from past movements are also automatically displayed. This visual data helps the trader assess whether to enter a trade – in this case, most historical analogies indicate a price increase, which confirms the bullish pattern.
Risk management and position size (money management)
- Risk per trade: For a small account of up to $500, it is key to risk only a very small portion of your account on each trade – generally no more than 1-2% of your capital. This means risking around $5-10 per trade. While this may not be much in absolute terms, it protects your account from being quickly depleted in the event of a series of losses. When scalping, it can be tempting to trade larger volumes for small profits, but disciplined risk management is essential for long-term survival.
- Position size: In practice, calculate the lot size so that the stop-loss (SL) distance corresponds to the chosen risk. For example, if the indicator or your plan determines an SL of 50 USD from the entry and you want to risk 5 USD, open a position size so that a 50 USD movement = 5 USD loss (i.e. 0.01 lot for BTCUSD, if 1 lot = 1 BTC, because 0.01 lot = 0.01 BTC and a movement of 50 USD is then 0.5 USD; for CFD brokers according to the contract). Always use a stop-loss – ideally at the level suggested by the indicator or just behind the pattern (e.g. a few points below the minimum of the pin bar for a long trade). Use a stop-loss to protect your capital in case the market does not go in the expected direction.
- Take Profit and RRR: Short-term trades usually aim for smaller profits, so the risk/reward ratio (RRR) can be lower than for long-term trades. However, still aim for an RRR of at least around 1:1 to 1:2. This means that if you risk $10, you are aiming for a profit of $10-20. The RTS5Pattern indicator will help you with this by indicating a reasonable TP level based on historical data – for example, if most analogs have achieved growth by a certain amount, you can place your Take Profit accordingly. Always consider volatility : on M1/M5, the price can move a few dollars quickly, but also quickly return, which is why sometimes scalpers take profit even at RRR ~1:1 and rely on high success rates.
- Daily loss limit: Set a maximum loss for each day (e.g. 5% of your account, i.e. $25 for a $500 account). If you fail and reach this limit, stop trading for the day. This will prevent emotional “revenge trading” that could lead to even greater losses.
Position management and trade exits
- Trade Monitoring: Trades in scalping move very quickly. After entering, watch the market and be ready to react immediately. If the price is going in the expected direction, that is ideal – however, you may consider partially closing the position after reaching the first smaller target (e.g. closing half of the position at RRR 1:1) and letting the rest run to the higher target by moving the SL to BE (Break Even, the entry price). This will ensure that the trade does not end in a loss, while giving you the chance to make a bigger profit from the second half.
- Reaction to adverse movement: If the trade does not develop well immediately after entry and the indicator assumption is not fulfilled (e.g. a sudden countertrend movement with high volume appears), do not hesitate to manually exit the trade early, even before the SL is hit. A small loss may be better than waiting for the full SL, especially for very small accounts. On the other hand, avoid impulsively exiting at every small noise – set clear rules for when to exit early (e.g. breaking a key level against the position that was the reason for entry).
- Trailing stop: In fast markets, you can also use a dynamic stop-loss (trailing stop) shift. For example, once a trade is in profit by $10, you move the SL to -5 USD, and at a profit of $15 to BE, at a profit of $20 to +5 USD, etc. However, apply this with caution – too tight a trailing stop can cause an early exit from an otherwise good trade on „noisy“ low TFs.
- Don’t trade overnight: With a small account and intraday tactics, it is advisable to close all positions before the end of the day (or before a period of lower liquidity). Unexpected gaps or increased spreads can occur overnight, which could disproportionately harm a small account. This strategy targets intraday movements, so there is no need to hold positions for a long time.
Signal filtering for short-term trades
On low time frames, there are many potential signals, not all of which are of high quality. Therefore, it is important to filter and trade only those with the highest probability of success:
- Support/Resistance Zones: Not every pattern on the chart is meaningful. Prefer patterns that form at significant levels. Before trading, mark intraday S/R levels on the chart (e.g. previous day’s high/low, pivot levels, round numbers like 25000, 25500, etc. for BTC). The RTS5Pattern indicator itself highlights important S/R zones, which makes filtering easier for you – signals reflecting from these zones have more weight. For example, a pin bar at support is much more interesting than a pin bar in the middle of the range.
- Volume: Also include analysis of trading volume in your decision-making. When scalping, a sudden increase in volume can confirm that the given movement has strength (participation of large players). Validate the volume pattern: for example, if a bullish engulfing occurs on M5 and at the same time you see that the volume of the engulfing candle is significantly above average, this is a better signal to buy. Conversely, a pattern without volume can be false.
- Inside Bar and Volatility: An inside bar (IB) often signals a moment of consolidation before a move. RTS5Pattern automatically marks inside bars – watch them. For example, a strategy could be as follows: after identifying an IB, wait for it to break through and only then take the indicator signal. The IB therefore acts as a filter – the trade is activated only if the price leaves the narrow range of the inside bar in the desired direction (e.g. above the high IB for long). This will avoid trading in the chop zone.
- Trend filter: Even when scalping, it is advisable to perceive the broader trend (e.g. the trend of the last few hours). Sometimes a simple moving average (e.g. 50 EMA on M5) will help – trade mainly in the direction of the intraday trend. If the trend is strongly down and you are trying to scalp long against it, be extra cautious and require a really strong pattern with confirmation. Otherwise, it is better to wait for patterns in the direction of the trend, which have a higher probability of success.
- Time filtering: For a small account, it is worth trading only at times when the market is sufficiently active, but not chaotic. For example, the main European and American sessions for crypto (approximately 9:00–11:00 and 14:00–17:00 UTC) can offer good movements. It is better not to trade late at night (low liquidity) or, conversely, during major fundamental news (excessive volatility). The RTS5Pattern indicator also displays statistics on the success of the pattern by day of the week – for example, it can show that Mondays had worse results. You can take this information into account and trade less aggressively or not at all on worse days.
Example of intraday trading (scalping scenario)
Situation: BTC/USD chart M5, account $500. In the morning, the price fell to the intraday support at $85,000, where it has already reacted several times in the past hours (strong support). In this zone, we see the formation of a bullish pin bar on M5 (long lower wick, closing price near the high) directly at the support, followed by a green confirmation candle. Trading volume jumped above average during the formation of the pin bar – a sign that buyers have entered the market.
Procedure: The trader clicks on the beginning and end of the formation (i.e. on the open pin bar and the close confirmation candle) and thus starts the RTS5Pattern. The indicator finds, for example, 3 historical situations when a pin bar appeared on a similar support and displays their further development. We see that in two of the three cases the price then rose sharply by about 100–150 USD during the following hour, in one case sideways. The aggregated yellow line points upwards. The indicator indicates the proposed TP ~+120 USD from the entry and SL ~-50 USD below the minimum of the pattern.
Decision: Given strong support, volume confirmation, and a positive historical prediction, the trader enters a long position at ~$85,050 (just above the high pin bar). He places the stop-loss below the local low at $24,980 (about $70 risk, which at 0.01 lot represents ~$7, or ~1.4% of the account). He sets the take-profit at $85,170 ($120 profit, RRR ~1:1.7). Since the risk of $7 is slightly above 1% of the account, he chose a smaller volume (to keep the risk below $5, he could choose an even smaller position or a narrower SL).
Progress: The price actually bounces off the support and rises within 30 minutes. After a profit of $50 (half of the TP), the trader moves the SL to BE (85,050). Shortly after, the level of $85,170 is reached and the take-profit is realized. The trader closes a profit of ~+$12 (2.4% of the account). The indicator confirmed the pattern’s functionality and the trade was successful. If the price had broken down instead, the SL would have kept the loss at -$7 and, thanks to the low risk, the trader could try a different pattern next time.
This example illustrates the principle: trade short-term small but probable moves with the RTS5Pattern, while sticking to S/R levels and strictly controlling risk. The key was to confirm the pattern with historical data (2 out of 3 cases succeeded) and volume, which gave the trader the confidence to execute the trade.
Automation options for short-term strategy
Automating a scalping strategy based on RTS5Pattern is challenging as the indicator requires interactive pattern identification and contextual assessment. However, the following options can be considered:
- Semi-automatic Expert Advisor (EA): You can have a simple Expert Advisor programmed to execute trades according to predefined rules, while you identify the pattern. For example: if you visually select a pattern and the RTS5Pattern indicator evaluates it positively (most historical trajectories in one direction), you can click or press a button in the platform to launch the EA, which will automatically set up a trade with a predefined SL/TP (e.g. according to the indicator’s design). The EA will thus ensure fast trade execution and position management (which is useful in a fast M1/M5 environment).
- Alerts and scripts: If the indicator provides alerts or output values (e.g. to the log or global variables), this can be used. You can set the indicator to send a notification (sound, pop-up) when a certain pattern appears in the S/R zone. You can achieve this by combining it with another indicator or script that detects candlestick formations and key levels. Once the alert comes, you manually run RTS5Pattern for confirmation. Full automation would mean that the program would identify the pattern itself, run an algorithm similar to RTS5Pattern (e.g. comparison with historical data) and decide on the trade. This is a very complex task, which essentially means replicating the indicator logic into the EA code – such development would be demanding and require detailed knowledge of how RTS5Pattern works.
- Automate trade management: An easier way to automate is to manage open positions. You can use an EA or a trade management script that will, for example, automatically move the stop-loss (trailing stop), close part of the position at defined levels, close all trades before the end of the trading session, etc. These aspects can be automated quite easily without the EA generating signals itself. You manually enter a trade based on the indicator and the EA will take care of the rest according to the money management rules.
- Automation testing: If you try to fully automate entries, backtest carefully on historical data. For scalping, slippage and spreads must also be taken into account – the EA should take into account that real entries/exits may differ from theoretical ones (especially for market executions on M1). You may find that some nuances that a person visually evaluates (e.g. avoiding a trade just before a news release or recognizing a false pattern) are difficult to automatically capture.
Overall, for a short-term strategy, it is difficult to completely replace human judgment. RTS5Pattern serves primarily as a decision support tool, not as a fully automated tool. Therefore, in practice, a semi-automated approach is more suitable – the trader identifies the pattern and context, the indicator evaluates it, and then either the trader himself or a simple EA executes and manages the trade according to the set rules.
Long-term strategy (accounts over $2000, higher TF)
For larger accounts ($2,000 and up), a longer-term approach to Bitcoin trading can be taken, focusing on swing or position trading. This strategy uses higher timeframes, such as the 4-hour (H4) or daily (D1) chart, and seeks to capture larger price movements (trends or significant reversals) with higher potential profit per trade. Trades tend to be less frequent, lasting from a few days to weeks or longer, and emphasize higher RRR (1:2 or more) and patience. The RTS5Pattern indicator can help verify whether historical precedent supports a given pattern – which is valuable for making key decisions on large TFs. The details of this strategy are elaborated below.
Setting up the RTS5Pattern indicator for swing trading
- Timeframe and usage: The long-term strategy operates on TF H4, D1 (or even W1 for very long positions). This also corresponds to the recommendation of the indicator author, who states the use of RTS5Pattern on time frames H4 and above for Price Action trading. On these TFs, the indicator has enough historical data to find quality matches and patterns tend to be more important here (they are larger formations, reflecting more significant S/R levels). Make sure that you have enough BTC history loaded into the platform (for D1, several years) for a better analogy search function.
- Recommended parameters:
- PredictionLen (prediction length): For swing trades, you can set a longer prediction horizon, e.g. 20–30 candles ahead. On H4 this means ~3–5 days, on D1 around 3–4 weeks. Such a prediction will show how far the price could move in a horizon of days/weeks, which helps in planning RRR and placing profit targets. Too short a prediction would not fully exploit the potential of the movement in a long-term trade. The indicator can thus tell you whether the pattern has historically led to a short bounce or a longer-term trend movement.
- MSQErr (error tolerance): At higher TFs, you usually want stricter pattern matching criteria, because each individual trade is significant and we prefer only situations with really strong analogy in the past. It is therefore recommended to set MSQErr lower, e.g. in the range of 0.2–0.3. This will cause the indicator to only consider very similar historical patterns and ignore more distant (less similar) cases. This may result in fewer matches, but they will be more relevant. If the setting is too strict and the indicator does not find any matches even for a high-quality looking pattern, you can increase the tolerance slightly (e.g. from 0.2 to 0.3).
- S/R and Inside Bar: Turn on automatic S/R zones – on D1, the main swing high/lows are usually clearly visible, which the indicator marks. These levels will play a role in your decision-making (e.g. you are trading a bounce from weekly support). Inside bars are also relevant on H4/D1, where they often signal a transition from consolidation to a trend; the indicator can mark them, which can help identify breakout situations, for example.
- Other parameters: If the indicator offers a choice of the number of historical analogies displayed, you can leave it at 3 (default) or increase it to 5 if you want to see more cases. However, make sure the chart is clear. You do not need to monitor any options that are not essential for the long-term context (e.g. statistics by day of the week), or you can turn them off in the settings so that they do not interfere.
Identifying patterns and timing trades (Price Action on higher TFs)
- Pattern Selection: On the H4/D1 Bitcoin chart, look for significant price formations and situations that typically signal a larger move. These could include:
- Candlestick reversal patterns: Pin bar / long lower wick after a strong decline at key support (indicating a possible rebound), large bullish engulfing just below resistance after a long downtrend (potential trend reversal), conversely bearish engulfing after an uptrend peak at resistance, etc.
- Multi-candlestick patterns: double bottom or head and shoulders formations, or longer consolidation (triangle, flag) followed by a breakout. These patterns form on D1 over days to weeks and their breakout or completion can lead to significant movement.
- S/R price action: A situation where the price after a longer movement tests a significant S/R level (e.g. historical high/low, long-term trend line) – watch what candles form there. Often, strong pinbars, outside bars, etc. form at these levels, which are ideal candidates for RTS5Pattern analysis.
- Using RTS5Pattern (click analysis): Once you identify a promising pattern on D1/H4, use the indicator similarly to the short-term strategy: mark the first and last candlesticks of the pattern (e.g., for a double bottom, the first touch and bounce, for an engulfing candlestick, the engulfing and engulfing candlestick). RTS5Pattern will go through historical data (many years of which are available for BTC on D1) and find the most similar cases in the past. Since the conditions are stricter (lower MSQErr ), it may happen that it will find only 1-2 really close matches – but even that is enough for insight. On the chart, you will again see the trajectories of these historical movements along the pattern and an aggregated yellow prediction line. In addition, the indicator will display an estimate of the probable TP and SL – these levels can be quite wide (e.g., TP hundreds or thousands of dollars from entry), which corresponds to long trades.
- Evaluation and context: Interpreting the indicator output on a higher TF is done similarly to the shorter one, but with an emphasis on the broader context:
- Look at how many historical cases were found and how consistent they are. For example, if the indicator found 3 analogous situations and all of them led to a 20% increase in Bitcoin price over the following month, this is a very strong signal that the pattern has significant bullish potential. If 2 led to an increase and 1 to a small decrease sideways, the bias is still more likely to be up – but more cautiously. If there are few matches or inconsistent results, consider skipping the trade or waiting for further confirmation (e.g. waiting another day for a close above resistance, etc.).
- Consider fundamentals and sentiment: For long-term trading, it pays to consider both fundamental and sentimental factors (which are outside of a purely technical strategy, but for the big picture). For example, if the pattern suggests bullishness but there is an important Fed meeting or negative news coming in the week, be conservative or leave more room. Historical analogies in the indicator may not capture these unique circumstances, so context is key .
- Confluent factors: The more factors that come together, the better. In addition to the pattern itself and its historical success thanks to RTS5Pattern, look for other indications that coincide : for example, whether the current trend has already been exhausted (weakened momentum), whether other markets (stocks, altcoins) are showing similar trend reversals, etc. RTS5Pattern gives you confidence based on the past, but support your final decision with current data.
- Entering the trade: If the analysis confirms your assumption, plan your entry. In a swing trade, there is no need to rush to the minute – it is more important to get a good entry with regard to the RRR. So-called limit orders are often used to enter: e.g. if the price has already rebounded a little from the support (after the confirming candle), you can try to buy a limit a little lower on the retracement (e.g. at the 50% pin bar candle) to get a better price. Sometimes, however, the market does not come back and it is better to enter behind the market right after the key candle closes. It depends on the situation – plan in advance what you will do. E.g.: “If D1 closes as a strong bullish engulfing from the support and the indicator confirms the historical strength, I will enter the next morning at the market price.”
Risk and position size management for a large account
- Risk per trade: Even with a larger account, the rule of 1–2% risk per trade should apply. For example, with a 2000 USD account, risk a maximum of ~20–40 USD per trade. Someone with higher capital can be even more conservative and risk only 0.5% (to withstand a possible longer series of losses). The advantage of a large account is that even 1% risk can represent sufficient profit in absolute value if the trade works out (e.g. 20 USD risk for RRR 1:4 = 80 USD profit, which is already 4% account appreciation). Do not deviate significantly above 2% per trade, because even on a large account, a few unsuccessful positions with higher risk can mean a significant loss of capital.
- Position size and SL: Calculate the position volume according to the stop-loss distance. On D1, the SL can be wide, e.g. 5-10% of the BTC price (for a volatile asset like Bitcoin, it can be thousands of dollars). You need to adjust the lot size accordingly. For example: account 5000 USD, risk 1% = 50 USD. If you enter long at 50,000 USD with SL at 45,000 USD ($5000 distance), then the position volume should be such that $5000 movement = $50 loss, i.e. 0.01 lot (because 0.01 BTC movement by $5000 is $50). It can be seen that with large SLs, the volumes are often small (fractions of a lot), which is fine – it is important to respect the risk. Place the stop-loss at a key level (e.g. below the second bounce of a double bottom, or above the high of a head and shoulders formation, etc.). The RTS5Pattern indicator can offer a certain SL level based on historical data, which can be a guide – it usually corresponds to the technical levels that you would choose manually.
- Take Profit and RRR: Long-term trades should have more ambitious targets. Aim for a RRR of at least 1:3 or higher. This means aiming for three times what you risk. You can often aim for 1:5, 1:8, etc. if you catch a really big trend. Plan multiple Take Profit levels: for example, the first partial TP at RRR 1:3, let the second TP run depending on the situation (maybe until the next big resistance). RTS5Pattern can show you that in the past, the price after the pattern typically went for, for example, $15,000 before hitting resistance – this can be the basis for setting the final target. Don’t be greedy, but also let your profits grow – with a larger account and long trades, it pays to use the potential.
- Multi-day holding and swaps: Make sure you understand the costs of holding a position overnight (swap points) with your broker, especially if you trade BTC via CFDs. Swaps tend to be higher for crypto. Plan your trades so that any multi-day swaps don’t eat too much into your profits. Alternatively, you can use futures or other swap-free instruments if available.
- Psychology and drawdown: A larger account begs for more benevolence, but be disciplined. For example, having 3 open swing positions, each with 2% risk, means a potential cumulative loss of 6% (~$120 on a $2,000 account) if everything goes wrong. Define in advance how many positions you will allow at the same time and what maximum drawdown you are willing to accept before reducing volumes or taking a break. Professional traders with larger accounts often work with the rule that if the capital drops by 10%, they will cut the risk in half until they work themselves back up.
Position control and outputs (swing position)
- Patience after entry: In swing trades, it often happens that immediately after entry, the price does not immediately go in the desired direction. It can consolidate for a few more days, test the level, etc. It is important to give the trade time and let the original analysis work. Do not stress yourself with every small fluctuation against the position on the D1 chart – you have set your SL, so you know how much you can lose at most. Of course, monitor whether the conditions do not fundamentally change (e.g. unexpected negative news broke out in the middle of the trade), but otherwise avoid unnecessarily frequent intervention.
- Monitoring the indicator in progress: You can continue to use RTS5Pattern even after entering to monitor the development . For example, after a few days in the trade, a new smaller continuation formation forms – you can mark it again and see if historical analogies still support the continuation of the trend. This will help you decide whether to hold on or take a partial profit. The indicator can also show how the patterns are performing over time – for example, if Mondays were great and Fridays were bad, and Friday is approaching, you can be more cautious about holding over the weekend.
- Partial sales: In large swings, it is smart to realize profits gradually. For example, open 0.04 lots; at RRR 1:3, close 0.02 lots (collecting profit, securing profit), keep the remaining 0.02 lots, perhaps with the SL shifted to the entry price (so the rest of the trade is already risk-free). If the trend develops, the second part can bring additional large profits. If not, you have at least earned something. This position management will improve the risk/reward ratio of the entire trade and psychologically it is better to hold.
- Moving the stop-loss: Once the trade is significantly profitable (e.g. the price has traveled half the way to the target), consider moving the SL closer to the current price. Typically, it is moved to break-even (to enter) after the market has traveled a distance equal to the risk. This eliminates the possibility of ending up in a loss. Later, you can trail below the swing lows (for longs) or above the highs (for shorts) on the daily chart. For example: you bought at 80,000, SL originally 78,000. When the price reaches 83,000, you move the SL to 80,000 (B/E). When it rises further to 86,000, you move the SL to 83,000, etc. But be careful not to move too aggressively – give the market room to breathe, otherwise a minor correction can unnecessarily throw you out of an otherwise valid trend.
- Exiting a position: In addition to reaching Take Profit, there are other situations when to exit a trade manually:
- If an opposite signal appears – for example, after a long long trend, a large bearish reversal pattern forms on D1 (which the indicator also evaluates as reliable), it may be wise to exit the long before the original TP is reached, and possibly even turn short (according to plan).
- If fundamentals suddenly take a negative direction (e.g., a crypto ban in a country, an unexpected hack of a major exchange) and you are holding a long position, consider closing or hedging even though the pattern looked good technically.
- If a trade has been stagnant for a long time – let’s say for 2-3 weeks the price has not broken out in the expected direction, and your capital is tied up, you may decide to free up funds and look elsewhere. But don’t do it hastily; stagnation after a pattern can also mean accumulation before a move (patience is a virtue, if the signal has not been negated).
Filtering signals on higher timeframes
Even on D1/H4, it is advisable to filter trades and take only the best set-ups:
- Multi-timeframe analysis: Look at the higher timeframe than you are trading. If you are planning to trade on H4, check the D1 trend; if on D1, look at the weekly (W1) chart. The ideal case is when the higher timeframe confirms the direction – for example, on the weekly the market is in an uptrend reflected from the long-term support, and on the daily you see a bullish pattern confirmed by the RTS5Pattern. Then there is a high coincidence of circumstances for long. Conversely, if the D1 pattern indicates growth, but the weekly trend is still clearly down and no break has occurred there yet, be conservative with targets or require further confirmation.
- Trend vs. countertrend: In general, trading in the direction of the dominant trend has a higher success rate than catching peaks and bottoms (countertrend). RTS5Pattern can also detect successful reversal patterns, but always think about whether you are going against a strong current. If so, make sure of the quality of the signal (e.g. an extreme reversal formation has formed on D1 after 5 consecutive growing weeks – a countertrend short makes sense there). But if the trend is down and you want to go long just based on a small formation, you should think twice. A trend filter can be implemented, for example, using a 100-day moving average: if the price is well below it, take shorts rather, etc.
- Support/Resistance and Supply/Demand Zones: On D1 there are key historical levels – previous highs, lows, zones where the price spent a lot of time (consolidation). A pattern that forms in such a zone is much more significant. For example, a false breakout above a previous high followed by a bearish engulfing is often a reliable signal to decline – and RTS5Pattern can confirm it, because such situations are repeated in history. Conversely, a signal in the middle of nowhere on D1 (far from any S/R) can be less reliable. Therefore, always draw the main S/R and watch if your pattern occurs near them (ideally yes).
- Volume and indicators: It is more difficult to get quality volume data on higher TFs (for crypto, volumes on exchanges are fragmented). However, if you have access to aggregated volume or futures volume, follow it – a large volume spike at a key level is a strong confirmation. Additional indicators can be used, for example, RSI or MACD divergence to reveal a weakening trend, which can add confidence when reversing a position. These are not necessary, but can serve as an additional filter: for example, a long pattern supported by a bullish divergence on the RSI is of better quality.
- Time and fundamentals: For long-term trades, be very careful around major fundamental events (macroeconomic data, central bank decisions, major crypto regulations). These can overwhelm technical signals. If, for example, a FED meeting is approaching, it may be wise to wait to open a large position until after the announcement, even if the pattern looked great. Or at least reduce exposure. Historical patterns in the indicator may not have included similar situations (Bitcoin may not have reacted to some events in the past in the same way as it does today). Therefore, the fundamentals act as a final filter: the trade must also make sense in relation to the reality outside the chart.
Example of a long-term trade (swing scenario)
Situation: BTC/USD daily chart. After a several-month downtrend, Bitcoin has fallen to the $20,000 level, which is both a psychological boundary and an area of previous strong consolidation (high demand zone). At this level, a double bottom formation was formed – two declines to ~$19,800 two weeks apart, with the second decline not reaching a new low and followed by a strong green daily candle closing above the local high between the two days (so-called confirmation of the reversal). During the formation of the second bottom, the RSI indicator was in the oversold zone and showed bullish divergence (the second bottom with a lower price low, but the RSI is already higher). Market sentiment is still rather negative, but it seems that the selling pressure is weakening.
Using RTS5Pattern: The trader marks the first and last candlesticks of this pattern (the first touch of 20,000 and the confirmation candlestick breaking the inter-bottom high). For example, RTS5Pattern finds 2 very similar situations in history: 1) in 2020, when Bitcoin made a double bottom around $6,000 before turning into a bull run, 2) a smaller double bottom in 2022 after a local correction. Both historical trajectories show a subsequent significant price increase within a few weeks. The yellow aggregate line has a steep increasing slope. The indicator marks potential TP zones, for example, at $24,000 and $27,000 (depending on how far the historical analogues grew) and suggests an SL below $19,500 (i.e. below the pattern lows).
Decision and entry: Due to the coincidence of several factors – a double bottom at a key support, bullish divergence, historical analogies confirming a large increase – the trader decides to enter a long position. Since the daily candle has already closed quite high ($22,000), he chooses a limit entry tactic: he places a Buy Limit at the level of $21,500 (in the expectation that the price may once again correct down to about half the range of the confirmation candle). He places a Stop-loss at $19,300 (below both bottoms, just a little lower than the indicator SL, to be sure). He sets the primary Take-profit at $24,000 (close to the first suggested level and to the lower edge of the previous resistance area) and the secondary TP at $27,000 (a more ambitious target in case of a strong trend reversal).
Trade Management: The trader risks ~2% of the account on this trade (more confidence due to strong signals, but still within limits). The price does indeed drop slightly the next day and activates the 21,500 limit. Then it bounces up. In the following days, BTC grows, surpassing 22,500 and 23,000. When it reaches 24,000, the first TP is executed on half of the position (profit collected, RRR ~1:2 for this part, because the risk on that part was about $2,000 against the profit of $2,500). The second half is left open with the SL shifted to 21,500 (break-even). The trend continues, albeit more slowly – over the next week, Bitcoin climbs to 26,500. Here it begins to hesitate, and in addition, an important Fed meeting is approaching. The trader decides not to risk losing the unrealized profit and therefore manually closes the rest of the position at $26,500, even though it has not reached 27,000 TP. In total, he made around $4,500 on the trade (approx. +9% of the account).
Rating: The RTS5Pattern indicator helped the trader gain confidence in the double bottom pattern – historical situations have shown that such formations have often started larger uptrends in the past. This supported the decision to hold the trade longer and aim for high targets. At the same time, discipline in risk management and gradual profit taking ensured that even if the market turned earlier, the trade would not end in a loss. This example illustrates how the combination of Price Action, statistical analysis of the indicator, and good risk management leads to a robust long-term strategy.
Manage multiple stores and markets
The last part of the trading plan is devoted to recommendations on how to proceed if a trader applies the strategies described above to multiple parallel trades or multiple markets simultaneously:
- Prioritization and selection: Especially for a small account, it is wise to trade only a limited number of positions at a time (preferably 1-2 active trades). If RTS5Pattern generates multiple signals at once (e.g. on different time frames or markets), choose the one with the highest quality (based on the confluence of factors, pattern strength, indicator results). There is no point in splitting a $500 account into 5 positions – both the risk increases, and the costs (spread, commission) increase, and you lose focus. For a larger account, you can hold 3-5 swings in parallel, but still set the maximum total risk that you are willing to take if they all go against you (e.g. max 6-8% of the account in the worst-case scenario).
- Market Correlation: If you trade multiple markets (e.g. BTC, Ethereum, other altcoins, or even other asset classes), be aware of their correlations. Cryptocurrencies tend to be highly correlated – when BTC goes down, so do the others. So long signals on both BTC and ETH at the same time are not exactly diversification; they are more like double bets in the same direction. In that case, either:
- Limit positions (for example, take only the one that looks better, or divide the risk between them – e.g. instead of 2% risk on BTC and 2% on ETH, put 1% and 1% so that in a negative scenario you lose 2% in total).
- Or clearly state that you treat these correlated trades as one combined position and manage them accordingly (e.g. close both when the total profit reaches a certain level, etc.).
- If you trade uncorrelated markets (say, BTC and the S&P500 index, gold), you can afford to hold independent positions, but still monitor the overall risk.
- Portfolio Management: Keep an eye on your overall portfolio. While each strategy or trade can be planned in isolation, it’s important to continually assess how you’re doing overall. Are your short-term trades doing well while your long-term trades are stagnating? Or vice versa? This information can lead to decisions to adjust your allocation – for example, by devoting more capital or mental energy to what’s working well and cutting back on what’s not working (of course, with caution, so that it’s not just a temporary setback).
- Journal and evaluation: Keep a trading journal across all trades and markets. Write down what patterns you traded, what the RTS5Pattern settings were, what the indicator showed, what the result was. This will allow you to find out over time which types of patterns or situations work best for you. You may find that, for example, inside bar breakouts confirmed by the indicator work great for you on BTC, while not so much for altcoins, or that long-term trades earn you more than scalping – then you can optimize your plan (increase the frequency of IB breakouts, or move capital from one strategy to another).
- Adjusting the indicator settings according to the market: RTS5Pattern was tuned mainly for Bitcoin, but it can be used for other markets (forex, commodities, stocks), as the principle of pattern search is general. If you apply it elsewhere, you may need to adjust the parameters. For example, in a less volatile market than BTC, you could reduce PredictionLen (because big moves are rarer) or MSQErr (so that it finds enough patterns). Always run a few tests on historical data of a specific market to verify that the indicator finds relevant matches. Tracking multiple markets can be challenging, so consider specializing – for smaller capital, it makes sense to focus on BTC (or 1-2 largest cryptos), where you have the most experience, instead of being distracted.
- Liquidity and position size across multiple markets: For larger accounts, if you trade multiple markets, keep an eye on your available margin and liquidity. Cryptocurrencies may have higher margin requirements and lower liquidity at certain hours. If you open multiple positions at once and the market moves sharply against you, you could be hit with a margin call sooner than you think. Be conservative and don’t go full leverage on all your trades at once.
Below is a table summarizing the main differences and parameters of the two described approaches – short-term intraday and long-term swing – for a clear comparison:
| aspect | Short-term strategy (scalping, ≤500 USD) | Long-term strategy (swing, ≥2000 USD) |
|---|---|---|
| Time frames | M1, M5, M15 (intraday, fast movements) | H4, D1 (swing and position trades) |
| Trading style | Scalping / intraday trading, multiple trades per day | Swing trading / position trading, trades last for days to weeks |
| Indicator RTS5Pattern | Can also be used on low TFs (optimized for M5/M15) Recommended settings: PredictionLen ~10 candles; MSQErr 0.3–0.5; S/R and IB on | Used on recommended TFs H4/D1 Recommended settings: PredictionLen 20–30 candles; MSQErr 0.2–0.3; S/R and IB on (greater importance of S/R) |
| Typical patterns | Short-term candlestick formations (pin bar, engulfing, inside bar break) at intraday S/R levels | Significant PA formations (pin bar, engulfing, double bottom/top, triangle) at key S/R levels, trend lines, etc. |
| Risk management | Risk ~1–2% of account per trade (e.g. 5–10 USD) Lower absolute SL (narrow, a few tens of $) RRR usually 1:1 to 1:2 (quick profits) | Risk ~1–2% of account per trade (e.g. $20–50) Wider SL (hundreds to thousands of $ depending on volatility) RRR aims higher, usually ≥1:3 (larger moves) |
| Position control | Fast SL moves (often on BE early), possibility to scalp part of profit very early Do not hold overnight, close by end of day | Patient holding, SL shift only after significant movement Partial sell-offs at multiple levels, possibility of holding for weeks or longer (while maintaining the trend) |
| Signal filtering | Focus on intraday S/R, volume, inside bar for breakouts, trend of the day Avoid trading during major short-term news | Emphasis on higher TF trend, long-term S/R (weekly levels), multi-timeframe consistency Consideration of fundamentals (macro news, sentiment) before entry |
| Sample store | Long after pin bar at 5min support, TP ~$50–$100, held for a few tens of minutes | Long after double bottom on D1 at key support, TP ~ several thousand $, held for several weeks |
| Automation | Difficult full automation (human pattern selection required) Possible semi-automation: EA for fast executions, scripts for partial closures, alarms on patterns | Partial automation possible: pattern scanners on multiple markets, EAs according to defined rules (after testing indicator ideas), EA trade managers for trailing SL, etc. |
| Number of parallel positions | 1–2 max at the same time (for a small account, so as not to split risk and margin) | 2–5 simultaneously (a larger account can handle more positions, but watch the overall risk and correlations) |
Conclusion: The RTS5Pattern indicator can be successfully used both for quick intraday trades on a small account and for larger swing positions on a more capitalized account. In both cases, it serves as a tool to confirm price action patterns at important levels – it compares the current pattern with history and shows the likely next move and TP/SL levels. The short-term strategy benefits from frequent opportunities and quick action, but requires very strict discipline in risk management and signal filtering (to trade only the best). The long-term strategy tries to ride the big moves, emphasizes patience, broader context and higher RRR, while the lower frequency of trades allows for careful analysis of each entry.
In both approaches, it is crucial to understand that RTS5Pattern is not a signal generator, but a supporting analytical tool – the final decision is up to the trader. Therefore, always combine its outputs with your own judgment and risk management principles. However, when used correctly, the indicator can significantly increase the probability of successful trades by providing a statistically based view of „what happened when the market looked similar in the past“ – and this is invaluable information for any Price Action trader. Work systematically according to the plan, learn from the results and gradually fine-tune the strategy to best suit your trading style and target market. Good luck in trading!

Author: Tomáš Bělák