RTS5Pattern Profi EN – Professional Pattern Detection for MetaTrader 5
RTS5Pattern is a professional indicator for MetaTrader 5, created specifically for Price Action traders who rely on clean charts and the key importance of support/resistance levels. This tool combines the simplicity of Price Action with intelligent analysis of recurring price structures. It is designed to quickly and accurately identify price patterns in important contexts—without cluttering the chart with unnecessary indicators.
Why RTS5Pattern for Price Action Traders? Because every pattern tells a story.

No need for oscillators, moving averages, or complex calculations—everything is based on raw price, candles, and market structure.
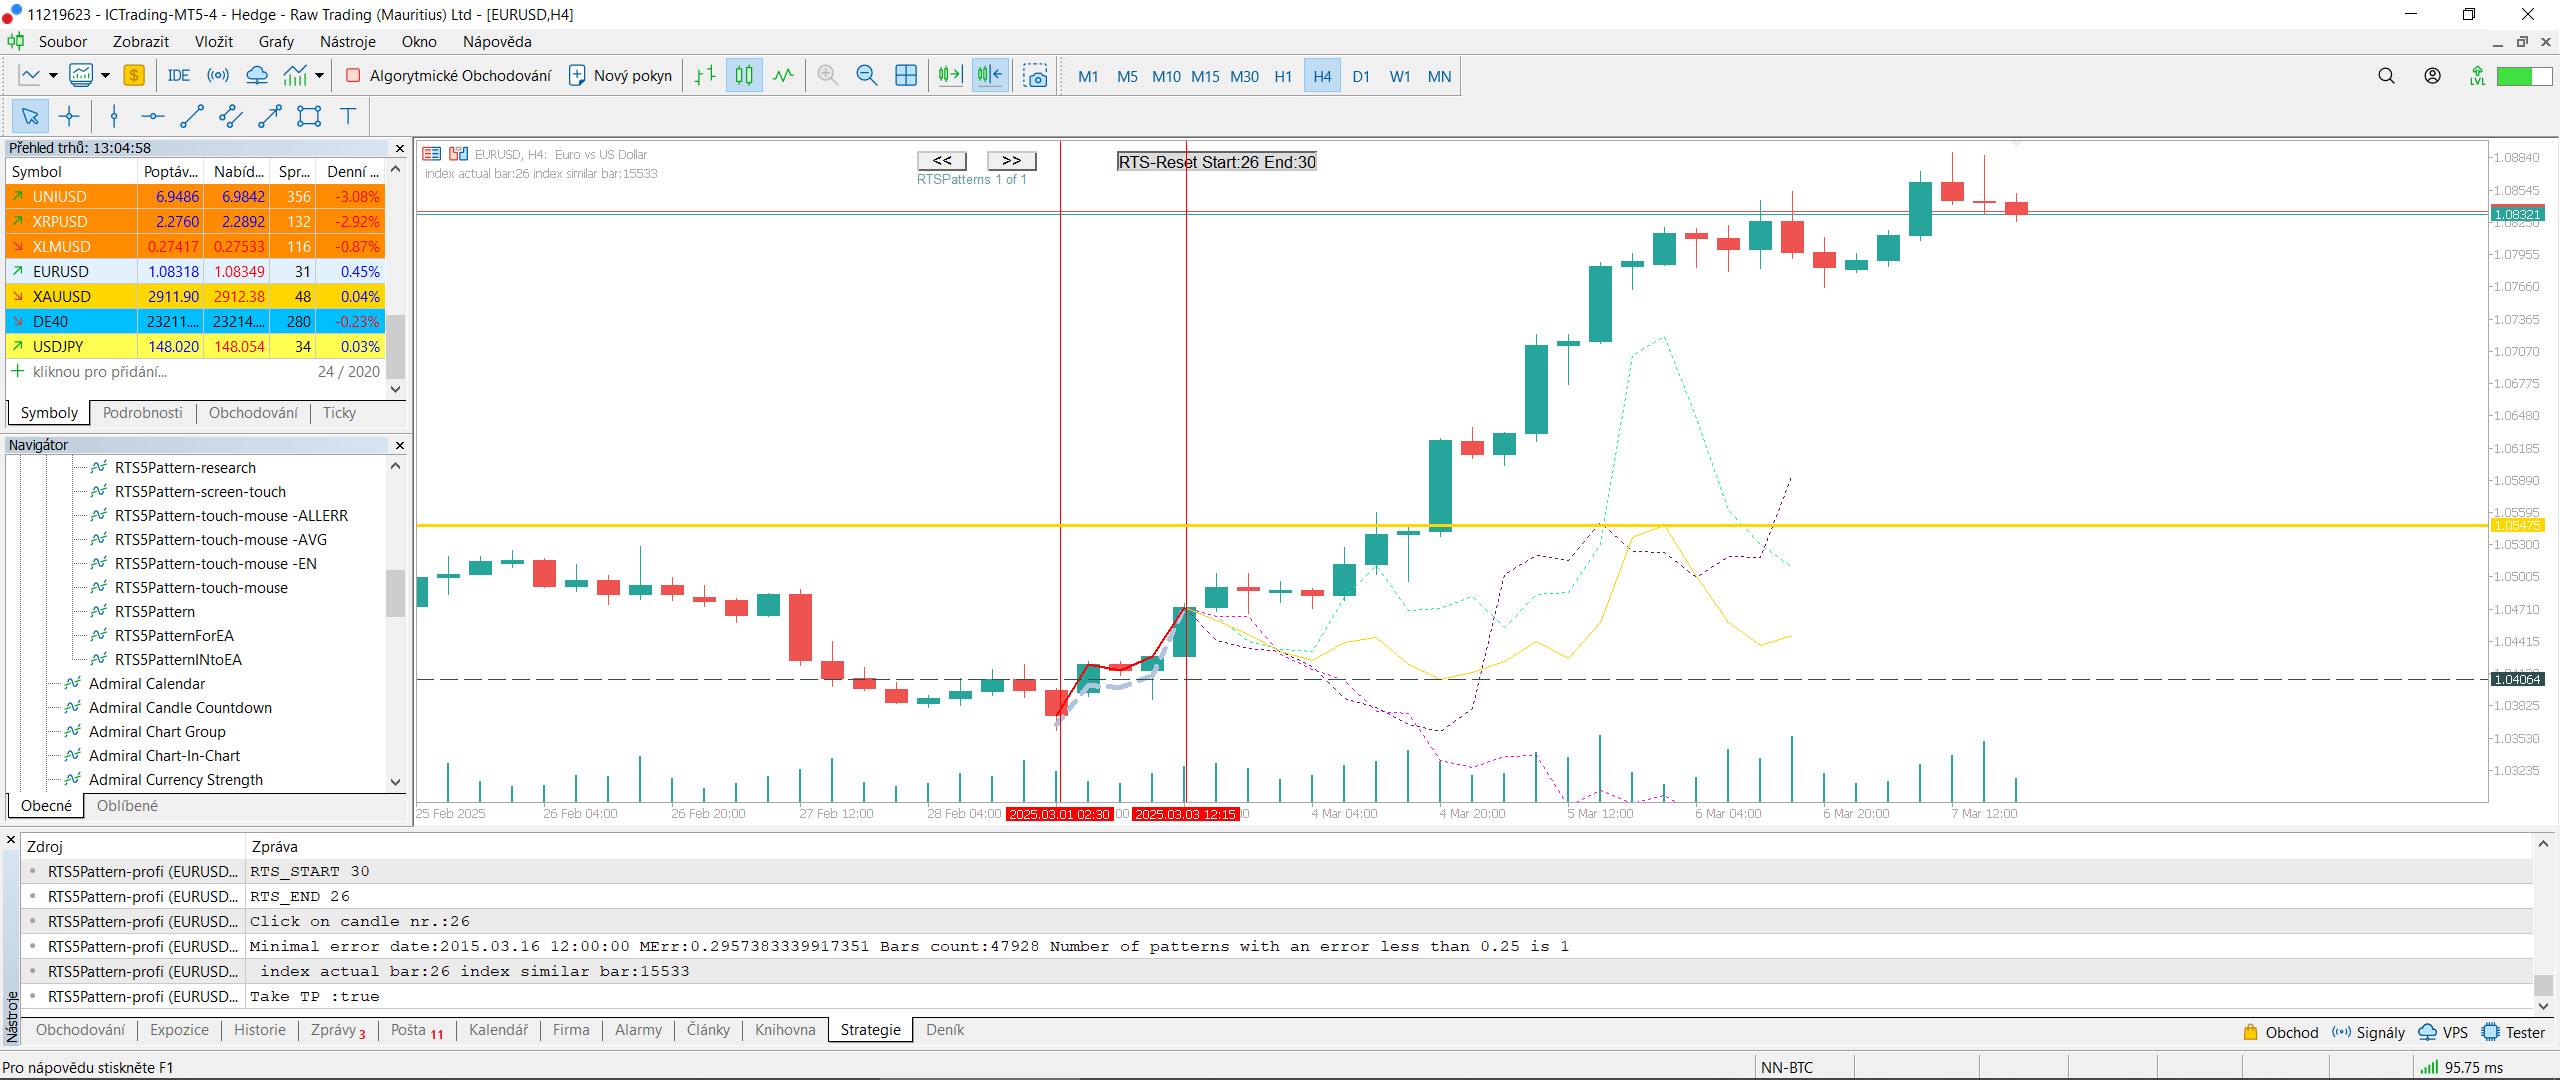
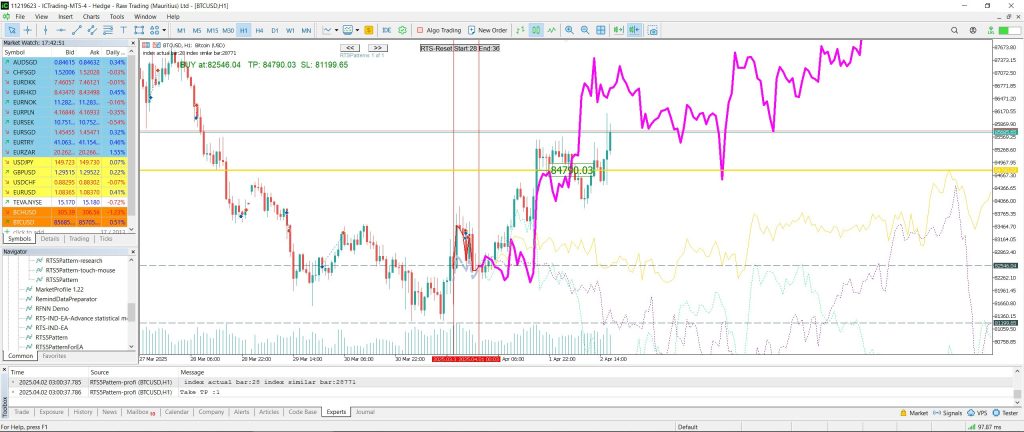
- Context-based detection: Click on the first and last candle of the pattern near an important S/R level. The indicator scans historical data for similar market conditions and shows how price reacted in those cases.
- S/R relevance: It works great for bounce tests, false breakouts, returns to balance zones, or breakouts from consolidation.
What can RTS5Pattern do?
- Pattern detection based on trader’s selection: You decide which candles form a significant pattern (e.g. pin bar, engulfing, or three-candle reversal).
- Instant comparison with historical situations: The indicator immediately finds and displays the most similar past occurrences along with how price developed afterward.
- Movement prediction: It shows the likely direction and TP/SL distances based on the history of similar patterns.
- Clean chart: All outputs are drawn subtly and clearly—they do not obscure the candles but complement them.
What does it give you?
- Backtesting of your Price Action patterns in real historical context.
- Support in decision-making—whether your pattern has a strong historical precedent.
- Ability to evaluate pattern strength by seeing how the market moved in similar past situations.
- High accuracy without overfitting—no curve fitting, no overtrained models.
Recommended Usage for Price Action S/R Style
- Prepare your chart – recommended timeframes: M15 to H4. Remove unnecessary indicators. Mark key support and resistance zones.
- Visually identify an interesting pattern in the S/R area, for example:
- a pin bar testing support,
- a strong rejection after a breakout,
- a reversal engulfing pattern just below resistance.
- Click on the first and last candle of the pattern – this gives the indicator a concrete example. It automatically scans history and finds the closest matches.
- Watch the prediction – three historically closest occurrences will be shown on the chart along with probable price movement. The aggregated result (yellow line) shows the dominant direction.
- Make decisions based on context:
- If the pattern behaves historically consistently and shows strong directional movement (clear TP far from entry), the indicator confirms your idea.
- If the development is erratic or no relevant matches are found, the entry might not be ideal.
Use it to confirm your ideas, not as an automatic entry signal. RTS5Pattern is not a “buy and sell” tool—it is for validating Price Action-based trading decisions.
RTS5Pattern is ideal for anyone trading Price Action and working with classic support/resistance levels. It helps traders quickly and efficiently verify whether their visually identified pattern has historical backing and provides context for future price expectations.

